


fig5
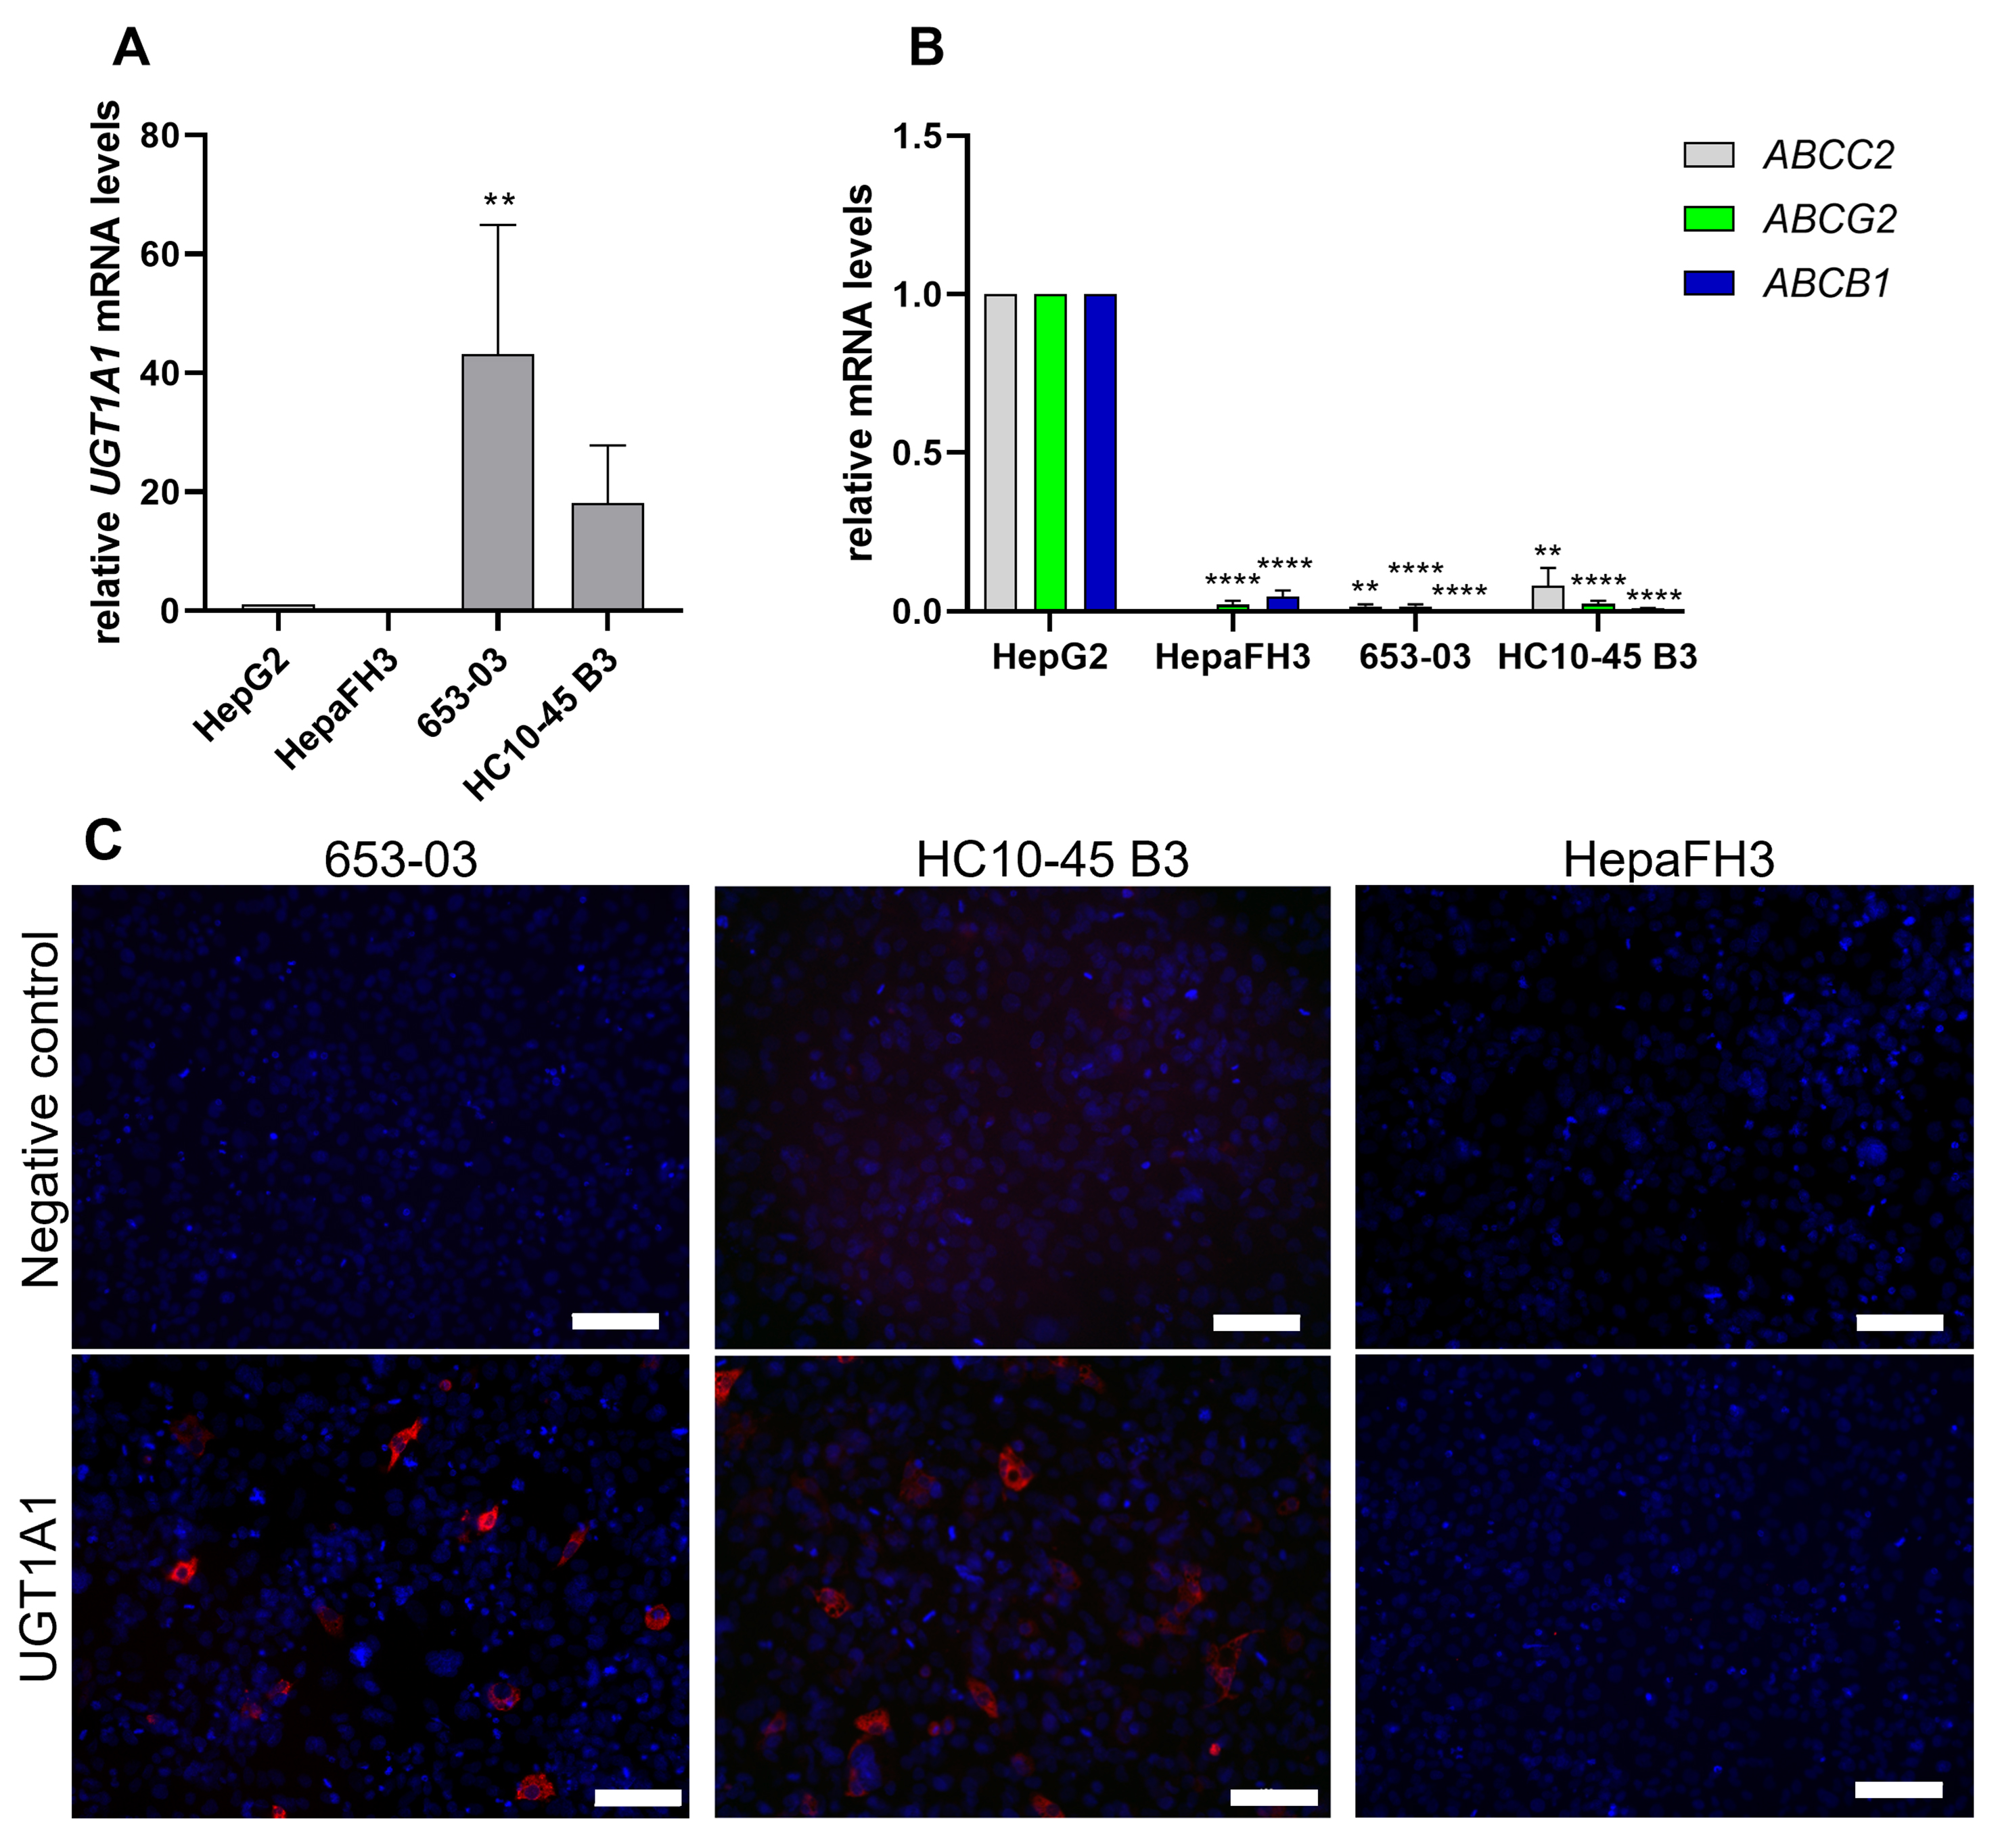
Figure 5. Relative mRNA expression levels of (A) UGT1A1 and (B) the pharmacokinetics/MDR-associated drug efflux transporters ABCC2, ABCG2, and ABCB1 in primary-like upcyte hepatocytes from three donors as determined by qRT-PCR. HepG2 cells served as a reference. The data were statistically analysed by one-way ANOVA followed by Tukey’s post-test for multiple comparisons (using HepG2 as the reference) with three biological replicates. Significance levels are denoted as follows: **P < 0.01 and ****P < 0.0001; (C) Protein-level expression of UGT1A1 (visualized by red fluorescence) in 653-03, HC10-45 B3 and HepaFH3 upcyte hepatocytes as determined by immunofluorescence staining. Cell nuclei were counterstained with DAPI (generating blue fluorescence). Scale bar: 100 µm. mRNA: Messenger RNA; MDR: multidrug resistance; qRT-PCR: quantitative real-time polymerase chain reaction; ANOVA: analysis of variance; DAPI: 4′,6-diamidino-2-phenylindole.


