


fig5
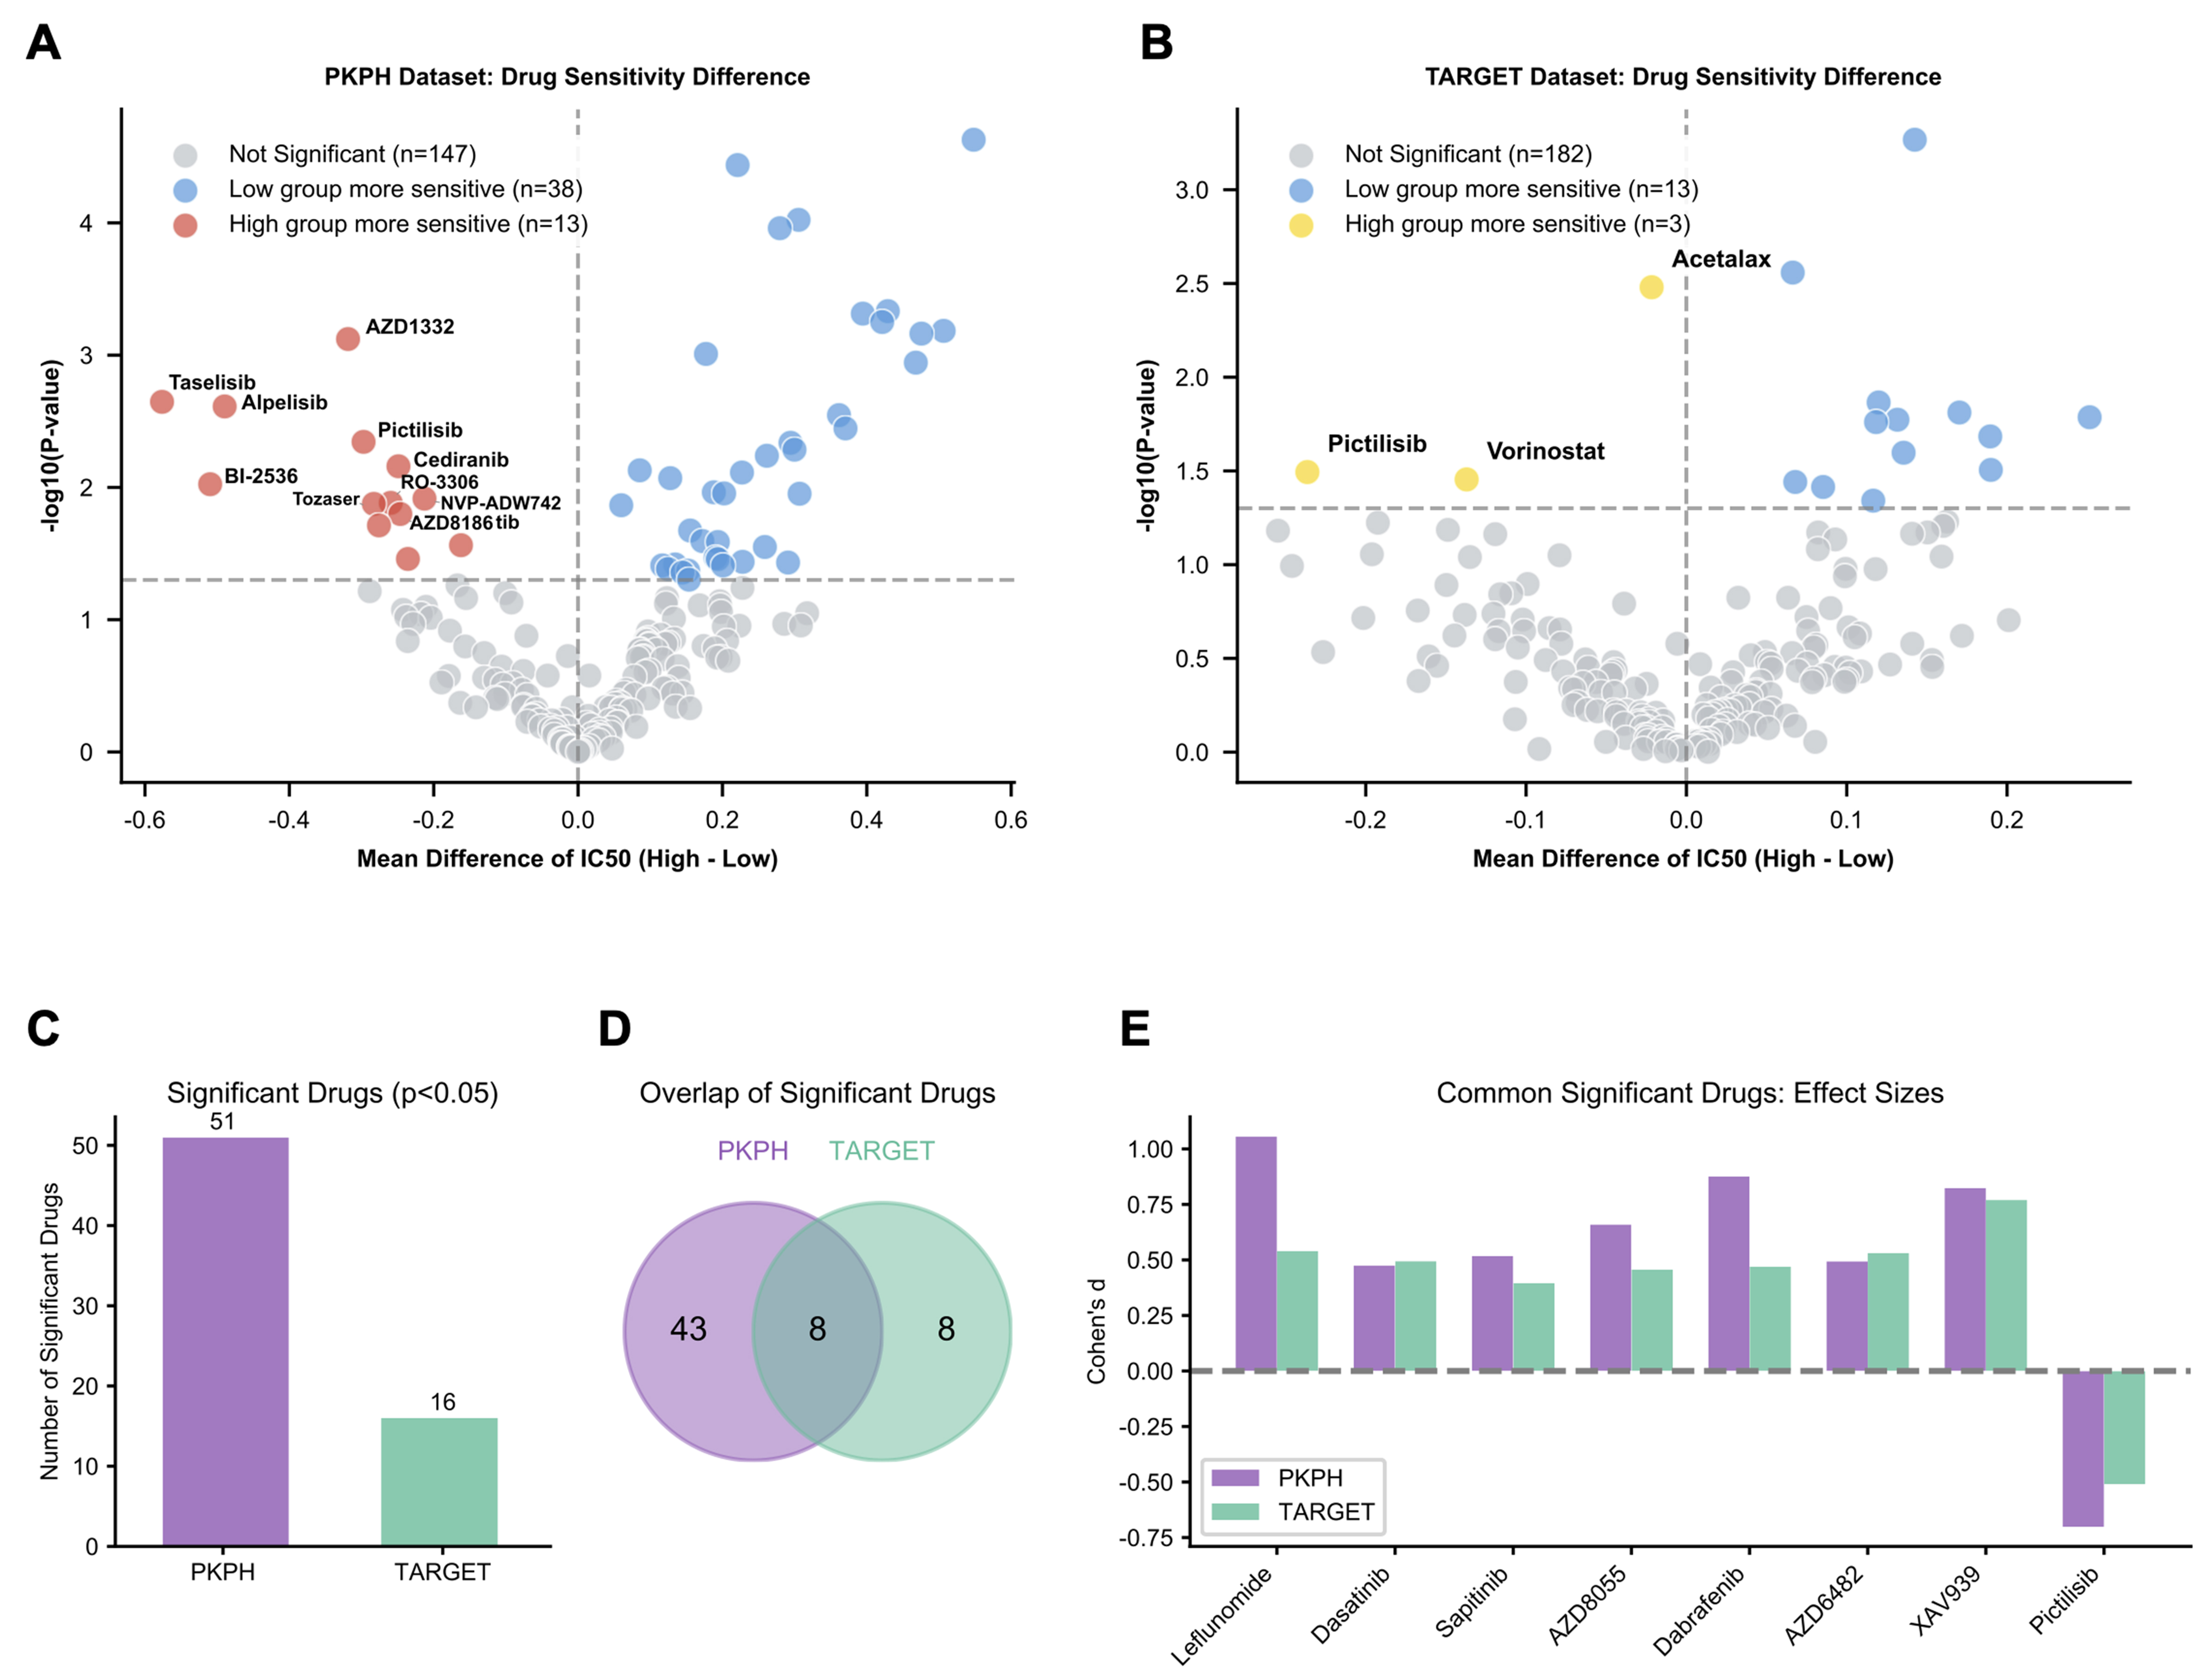
Figure 5. Drug sensitivity prediction identifies PI3K inhibition as a therapeutic vulnerability. (A) Volcano plot displaying predicted drug sensitivity differences (log2 fold change of IC50) between resistance score-high (n = 35) and score-low (n = 35) groups in the PKPH cohort. Drugs with significantly different sensitivities (FDR-adjusted P < 0.05) are highlighted; positive values indicate higher IC50 (resistance) in the high-score group; (B) Volcano plot displaying drug sensitivity differences between resistance score groups in the TARGET cohort (high, n = 43; low, n = 44); (C) Bar chart showing the number of drugs with significantly different predicted sensitivities in each cohort (PKPH: 51 drugs; TARGET: 16 drugs); (D) Venn diagram illustrating the overlap of drugs with significant sensitivity differences between cohorts, identifying 8 concordant drugs; (E) Bar chart showing effect sizes (Cohen’s d) for the eight drugs with concordant significant sensitivity differences. Notably, Pictilisib (PI3K inhibitor) is the only drug showing enhanced sensitivity (negative Cohen’s d, lower IC50) in the high-resistance-score group in both cohorts. For (A and B), drug sensitivity differences were assessed using two-sided Wilcoxon rank-sum tests with Benjamini-Hochberg correction. PI3K: Phosphoinositide 3-kinase; PKPH: Peking University People’s Hospital; FDR: false discovery rate; TARGET: Therapeutically Applicable Research to Generate Effective Treatments.


