


fig6
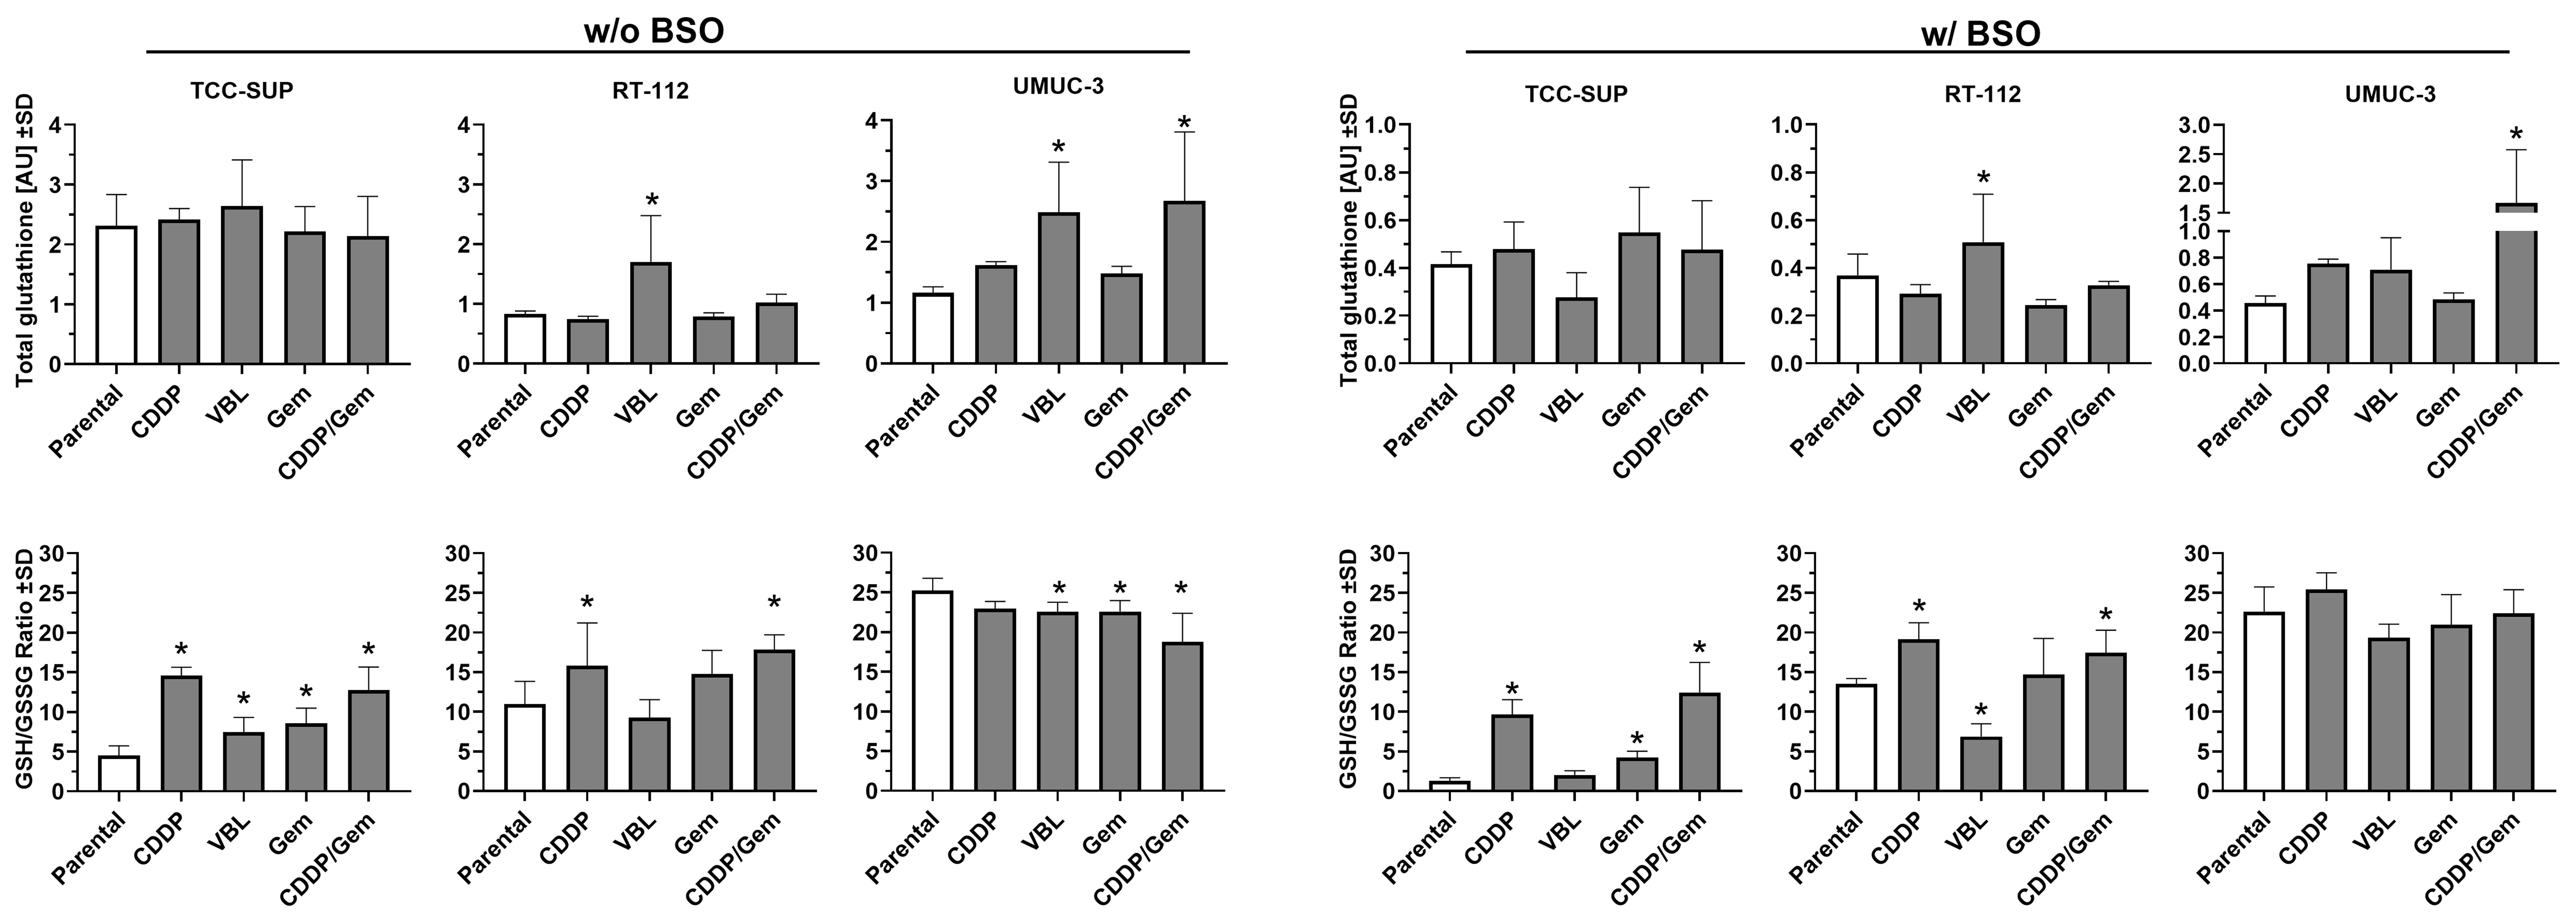
Figure 6. Comparison of total glutathione levels (upper panels) and GSH/GSSG ratio (lower panels) in drug-resistant sublines relative to their parental cell lines. The left panel shows results without BSO pre-treatment, while the right panels show results after 24 h pre-treatment with 100 µM BSO. Data (n = 3-4) were analyzed according to the manufacturer’s protocol and are presented as mean ± SD. *P < 0.05, one-way ANOVA with Dunnett’s post-hoc test, compared to the corresponding parental cell line. GSH: Glutathione; GSSG: glutathione disulfide; BSO: buthionine sulfoximine; SD: standard deviation; ANOVA: analysis of variance.


