


fig3
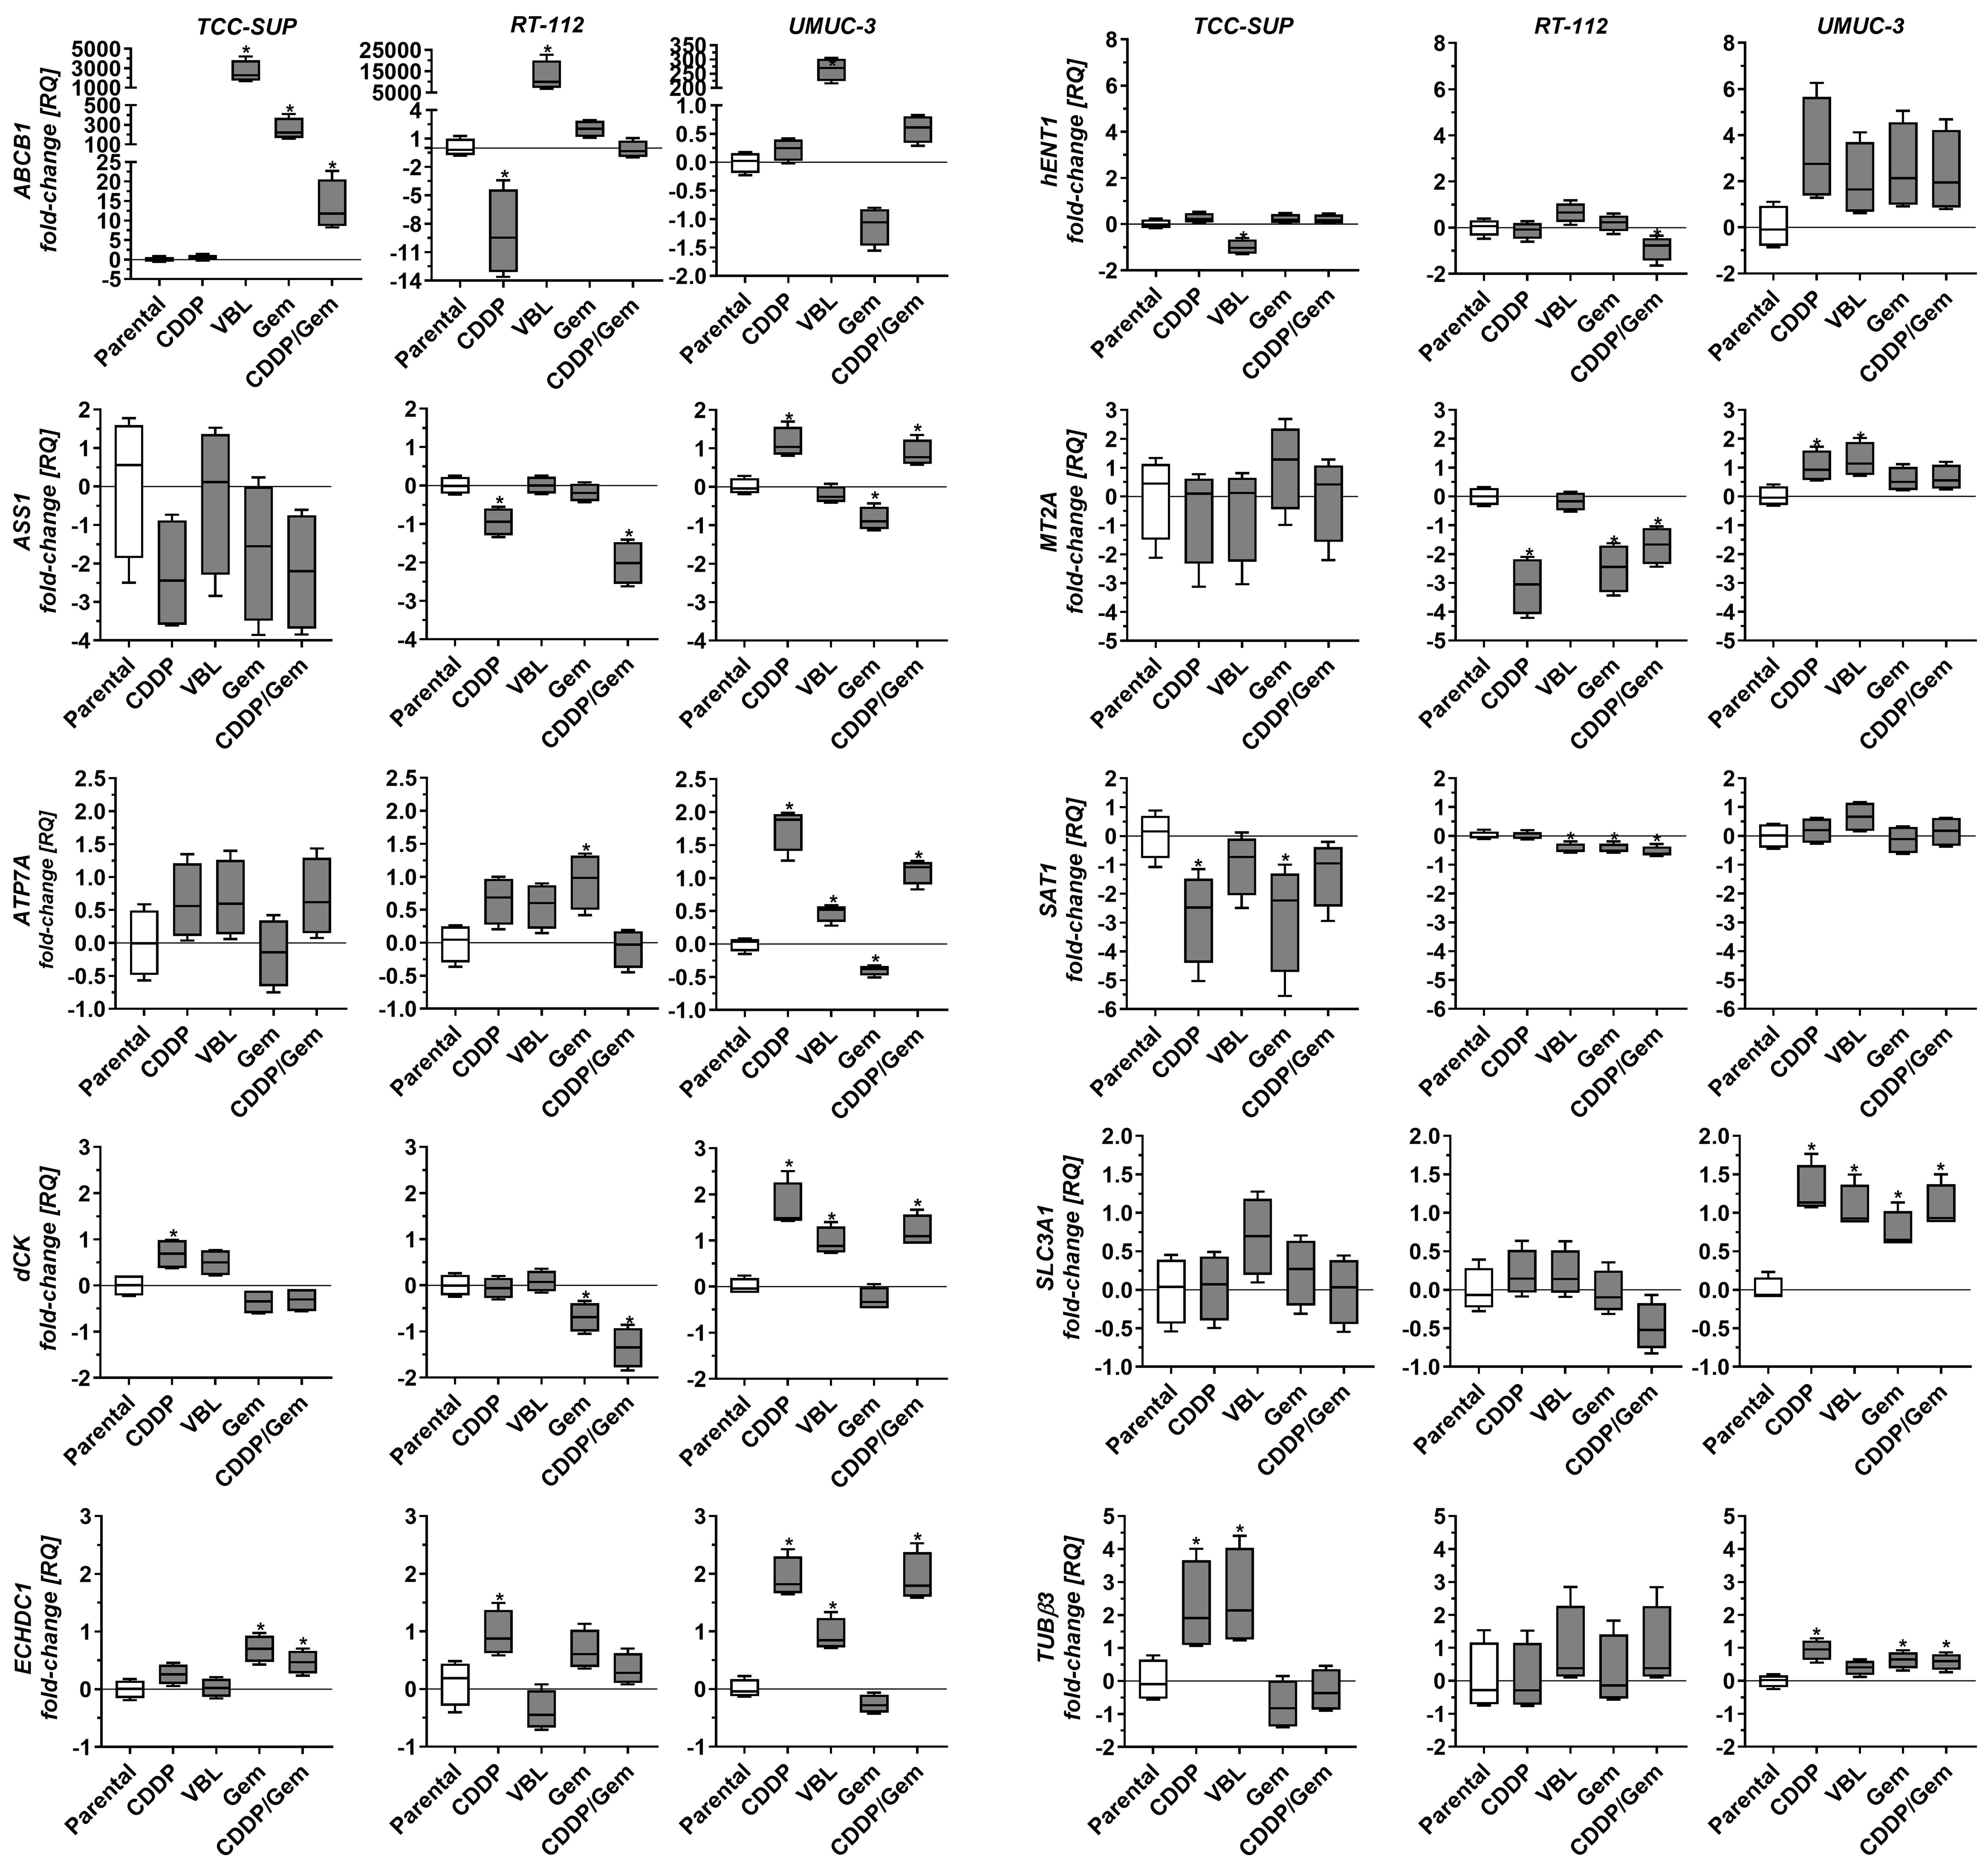
Figure 3. Comparison of selected gene expression in drug-resistant sublines relative to parental cell lines. Quantitative real-time PCR results were normalized to GAPDH and expressed relative to the mean mRNA level of each gene in the corresponding parental line. Results (n = 4) are shown as box-and-whisker plots, with whiskers indicating minimum and maximum values. *P < 0.05 to parental line, oneway ANOVA with Dunnett’s post-hoc test. PCR: Polymerase chain reaction; ANOVA: analysis of variance.


