


fig4
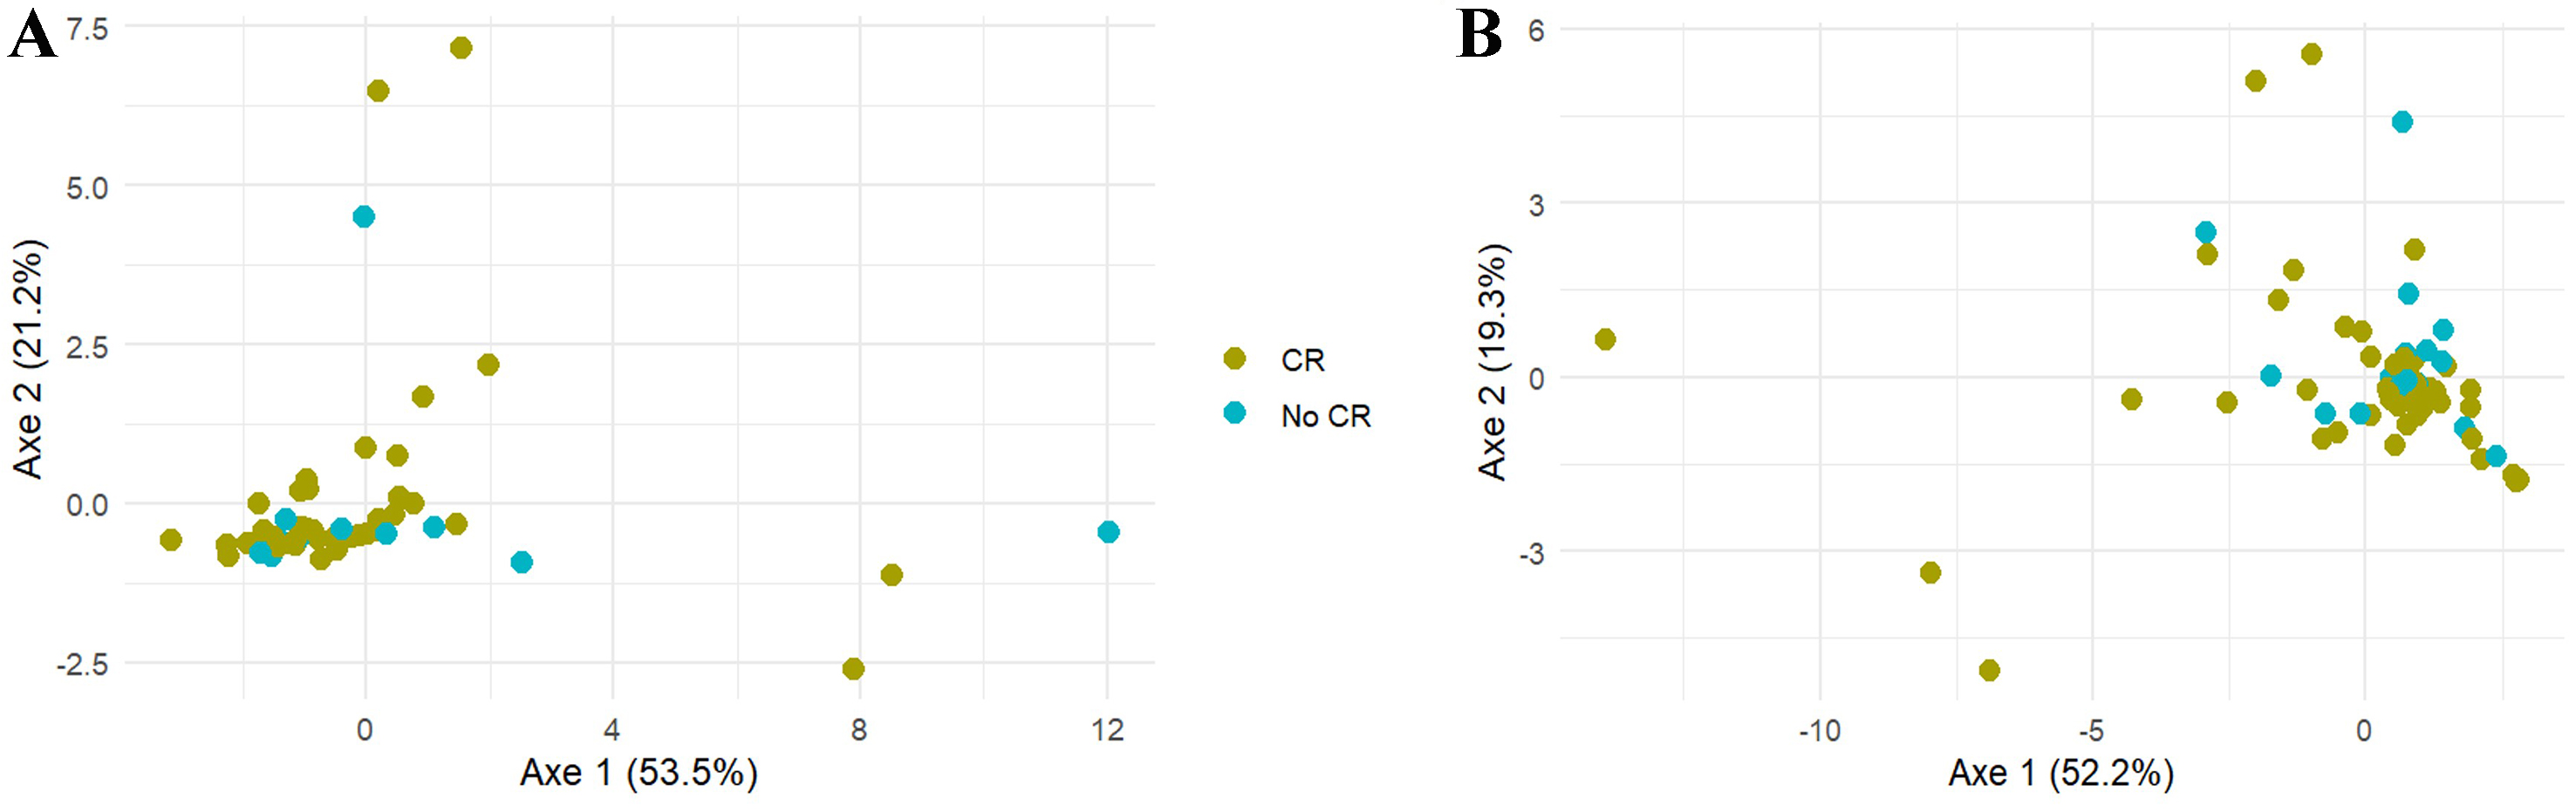
Figure 4. Comparison of the nucleotide pool in (A) PBMC and (B) BMMC depending on the occurrence of CR using a PCoA visualization. PBMC: Peripheral blood mononuclear cells; BMMC: bone marrow mononuclear cells; CR: complete remission; PCoA: principal coordinate analysis.


