

fig5
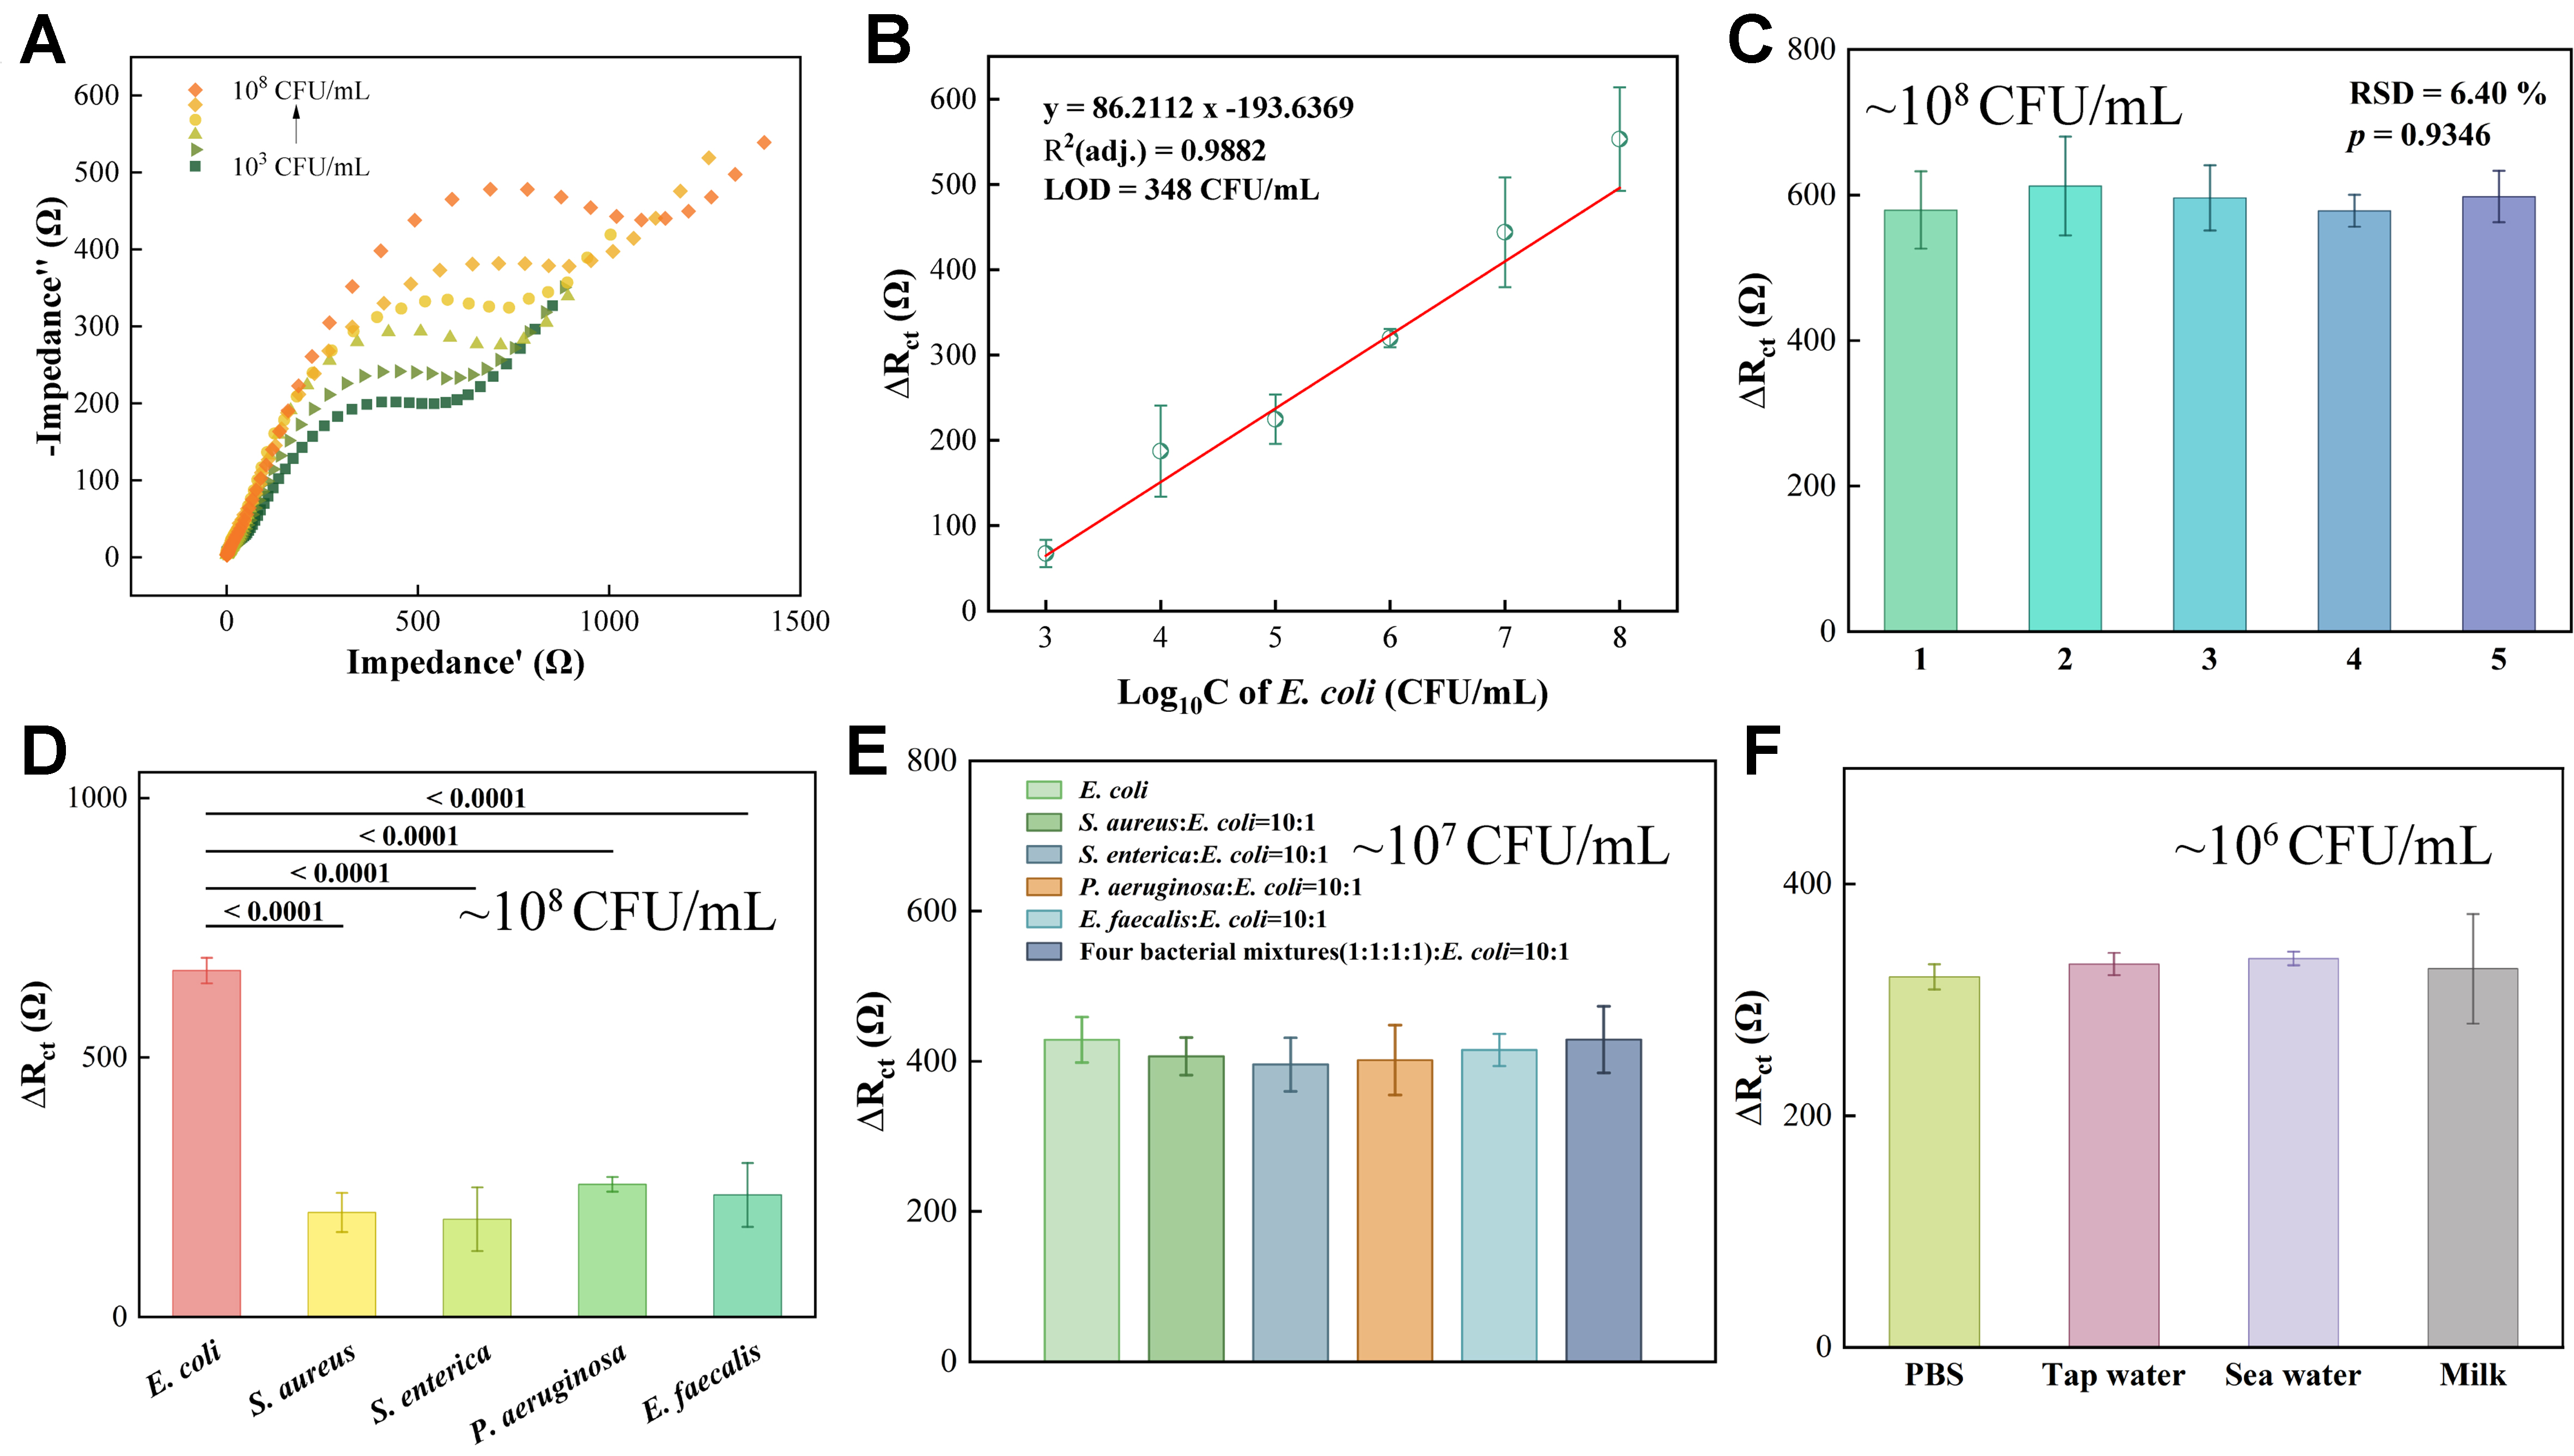
Figure 5. Quantitative and performance evaluations of BIP-DLW-PDMS sensors for E. coli detection. The DLW_3 electrode was used for all experiments. (A) Nyquist plots showing the sensor’s response to E. coli concentrations from 103 to 108 CFU/mL; (B) Calibration curve plotting the change in charge transfer resistance (ΔRct) against the logarithm of bacterial concentration. The linear regression equation is ΔRct = 86.2112Log10CE.coli - 193.6369; (C) Reproducibility assessment across five independent batches, with three technical replicate sensors (n = 3) per batch for detection of E. coli at 108 CFU/mL; (D) Selectivity evaluation against four non-target bacterial species and the target E. coli (all at 108 CFU/mL); (E) Competitive selectivity test in a mixed solution containing target E. coli (107 CFU/mL) and non-target bacteria (108 CFU/mL), with a target E. coli to non-target bacteria ratio of 1:10; (F) Sensor response to E. coli (106 CFU/mL) spiked into real-world samples (tap water, seawater, milk). All experiments were performed in triplicate (n = 3). Data are presented as mean ± SD. Statistical significance was determined using ANOVA with Tukey’s test. BIP: Bacterial-imprinted polymer; DLW: direct laser writing; PDMS: polydimethylsiloxane; E. coli: Escherichia coli; CFU: colony-forming unit; SD: standard deviation; ANOVA: analysis of variance; LOD: limit of detection; RSD: relative standard deviation; PBS: phosphate-buffered saline.





