



fig2
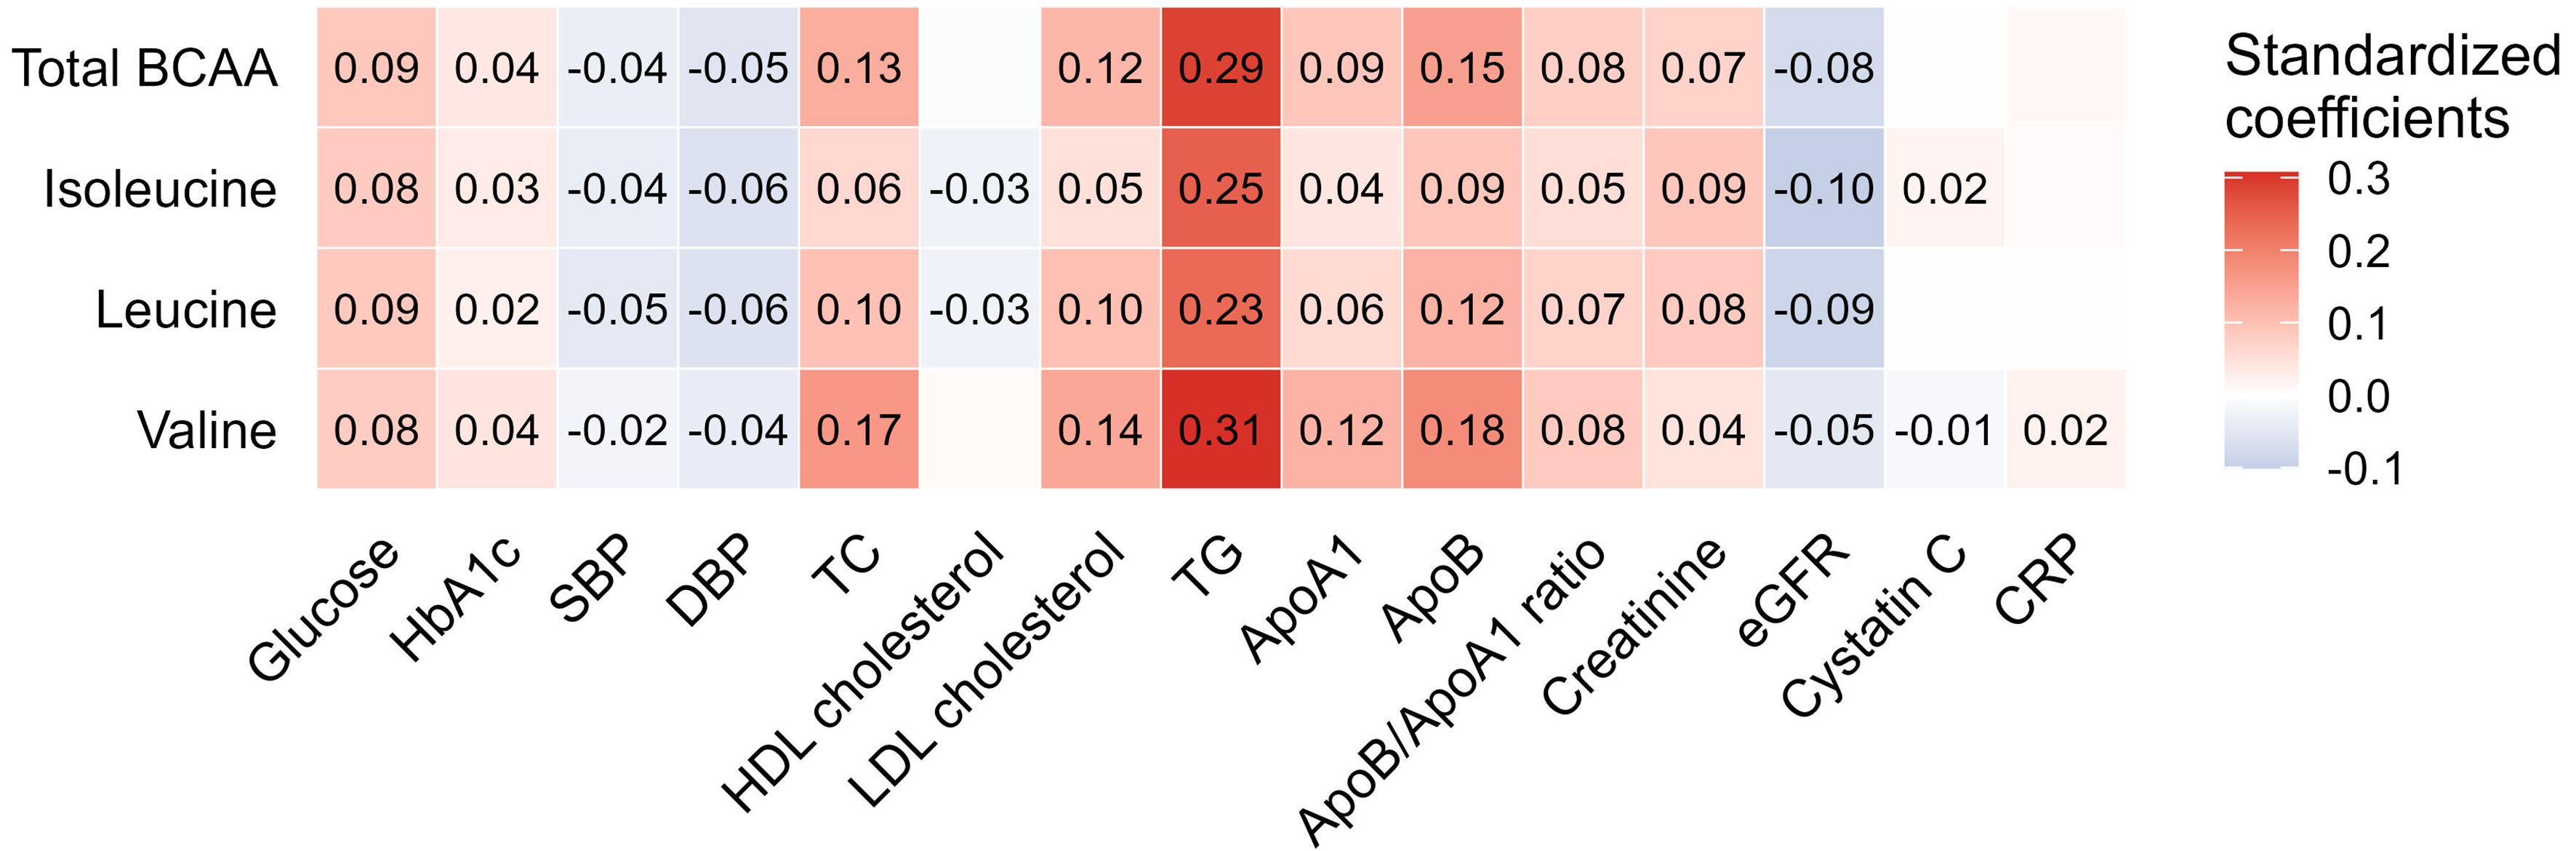
Figure 2. Associations between plasma BCAAs and cardiometabolic biomarkers. The heatmap displays standardized regression coefficients derived from fully adjusted multivariable linear regression models. Both plasma BCAAs and cardiometabolic biomarkers were log-transformed and Z-score standardized prior to analysis. Cells with standardized coefficient values indicate FDR < 0.05. BCAAs: Branched-chain amino acids; ApoA1: apolipoprotein A1; ApoB: apolipoprotein B; CRP: C-reactive protein; DBP: diastolic blood pressure; eGFR: estimated glomerular filtration rate; FDR: false discovery rate; HbA1c: glycated hemoglobin; HDL: high-density lipoprotein; LDL: low-density lipoprotein; SBP: systolic blood pressure; TC: total cholesterol; TG: triglycerides.





