




fig1
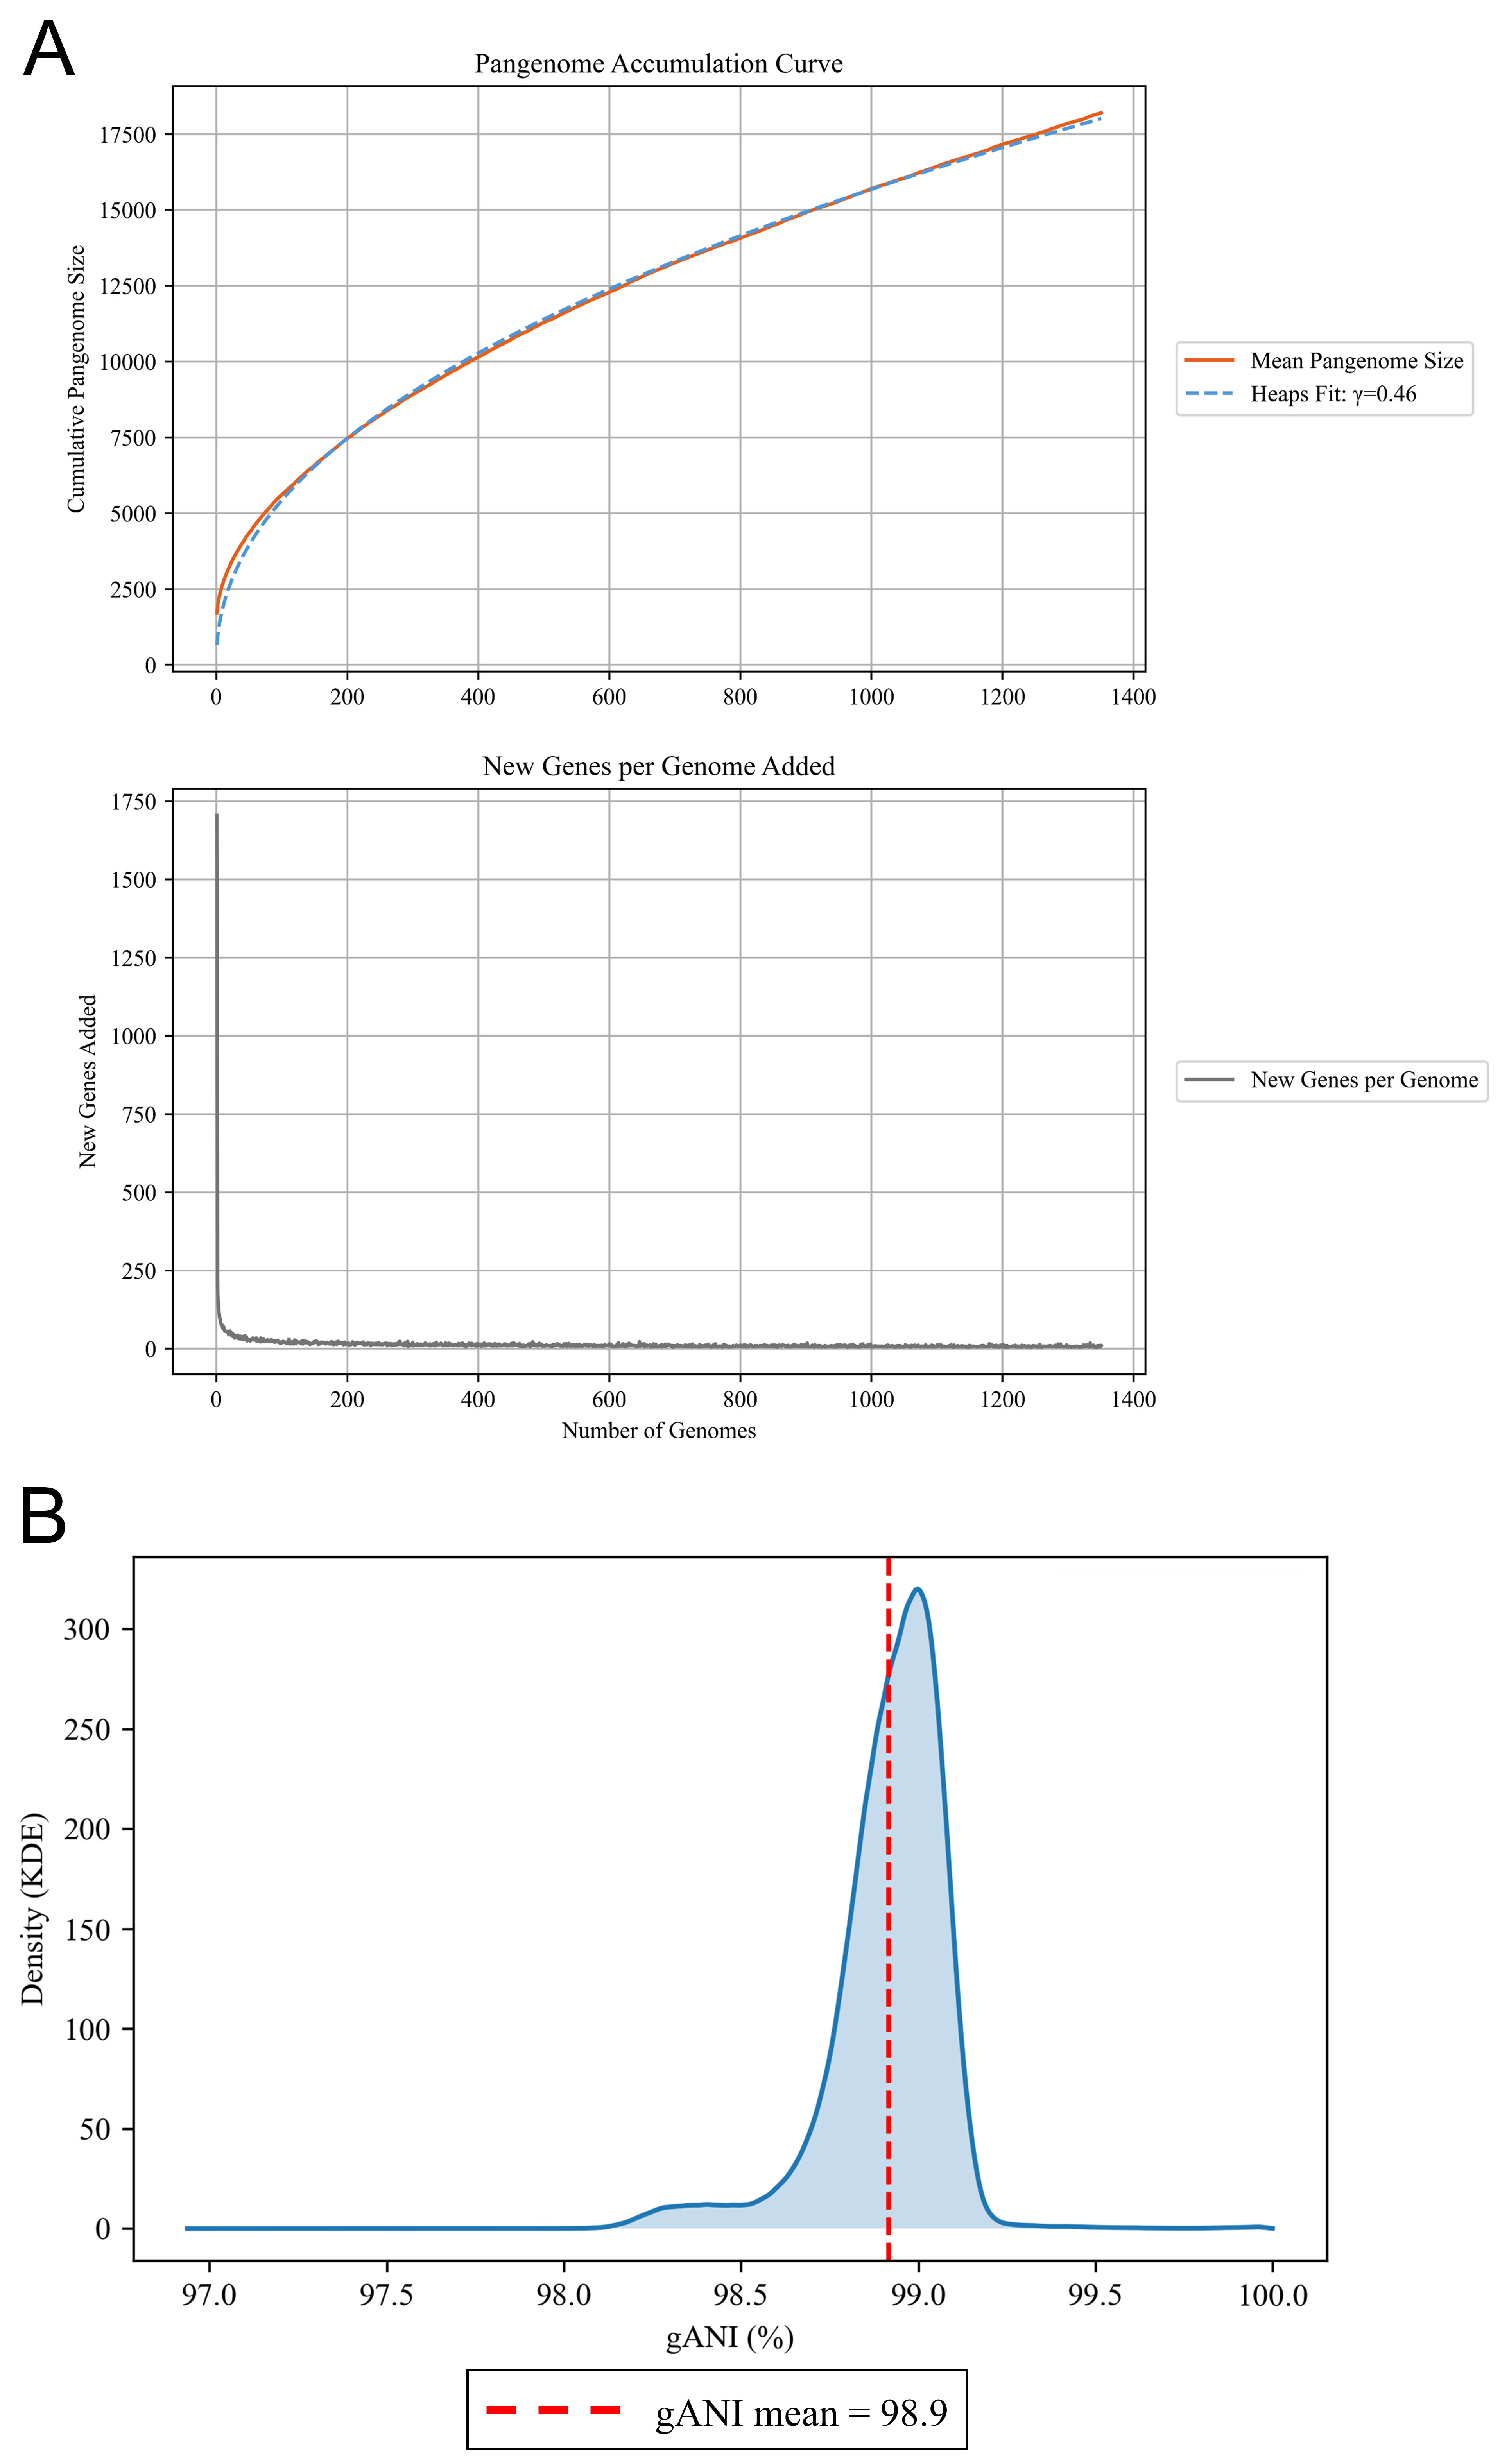
Figure 1. Pangenome architecture of the B. bifidum dataset. (A) illustrates the pangenome growth trends, showing variation in pangenome size and the identification of new genes resulting from the addition of 1,351 B. bifidum genomes, in the upper and lower graphs, respectively; (B) shows the genetic distance in the B. bifidum dataset via a density plot of ANI values obtained from pairwise comparison of genomes. KDE: Kernel density estimation; gANI: genome Average Nucleotide Identity; B. bifidum: Bifidobacterium bifidum.