


fig4
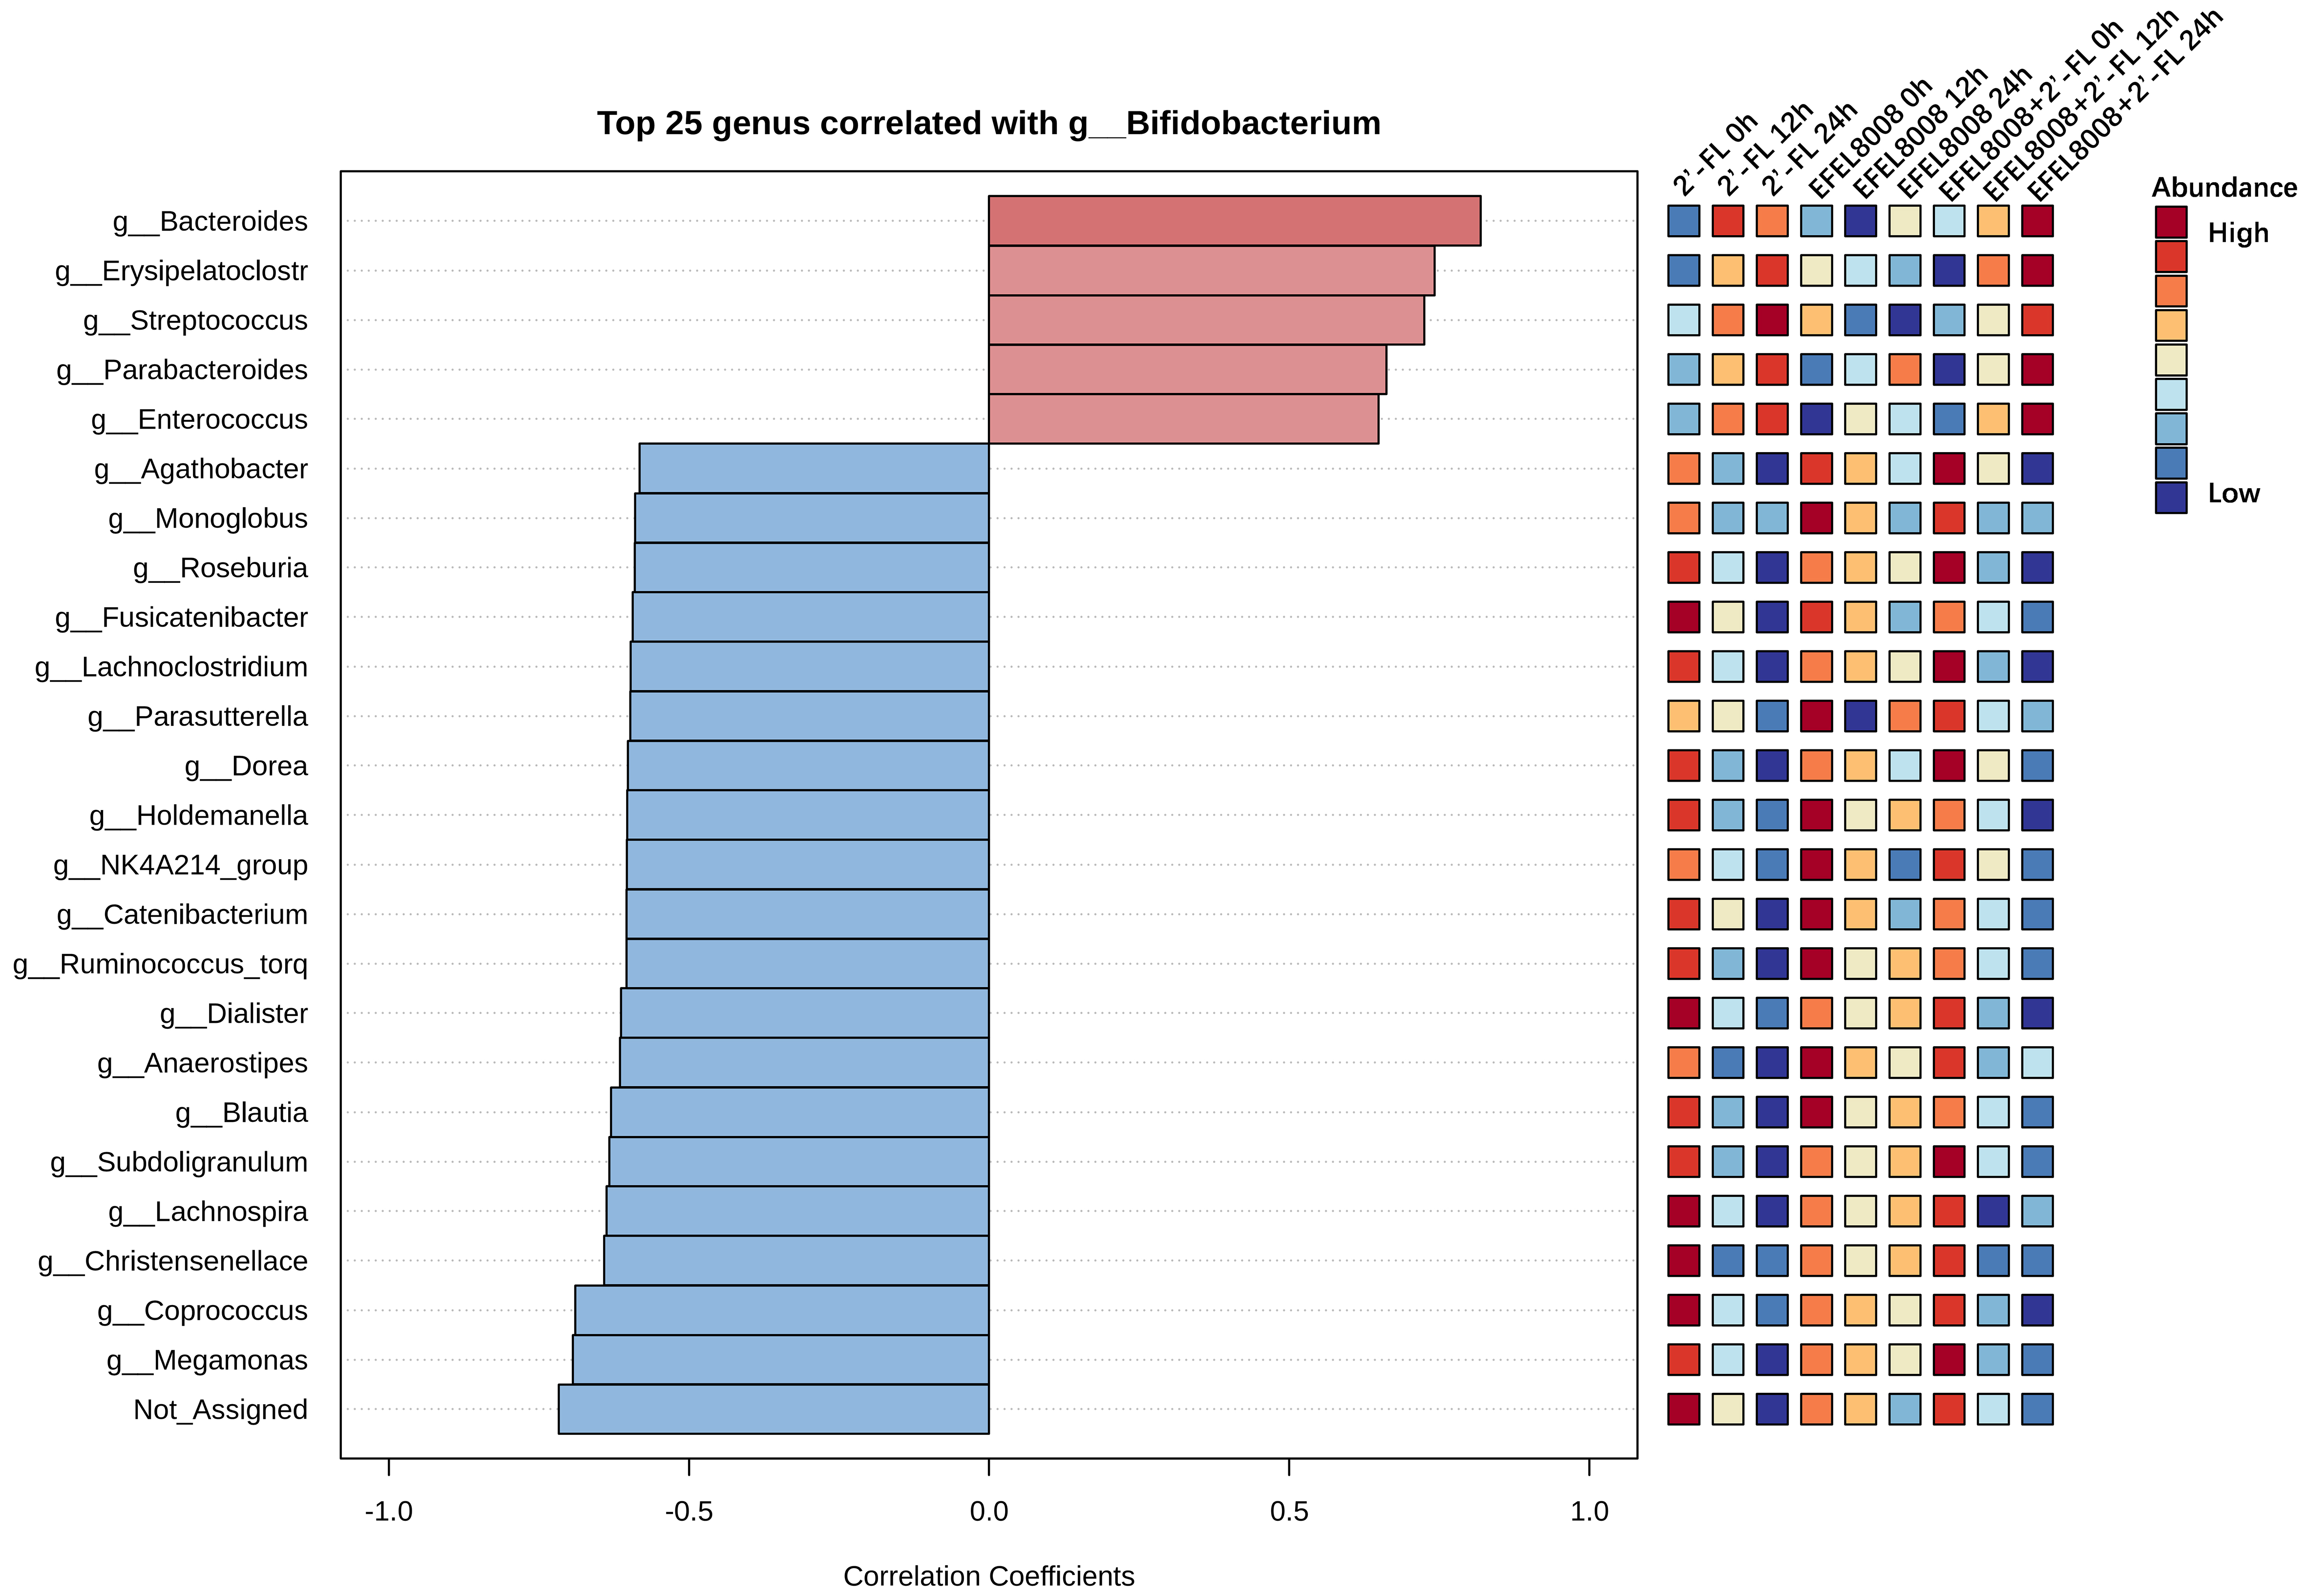
Figure 4. Pearson’s correlations using pattern search that identified the top 25 genera correlated with Bifidobacterium. Blue bars indicated negative correlations, while red bars indicated positive correlations, with deeper colors representing stronger correlations. The mini heatmap on the right displayed whether the abundance of each genus was higher (red) or lower (blue) in each group. 2′-FL, addition of 1% (w/v) 2′-fucosyllactose; EFEL8008, addition of B. infantis EFEL8008 at 3.51 × 10⁶ CFU/mL; EFEL8008 + 2′-FL, addition of B. infantis EFEL8008 at 3.51 × 10⁶ CFU/mL and 1% 2′-FL. 2′-FL: 2′-Fucosyllactose; B. infantis: Bifidobacterium longum subsp. infantis.


