fig2
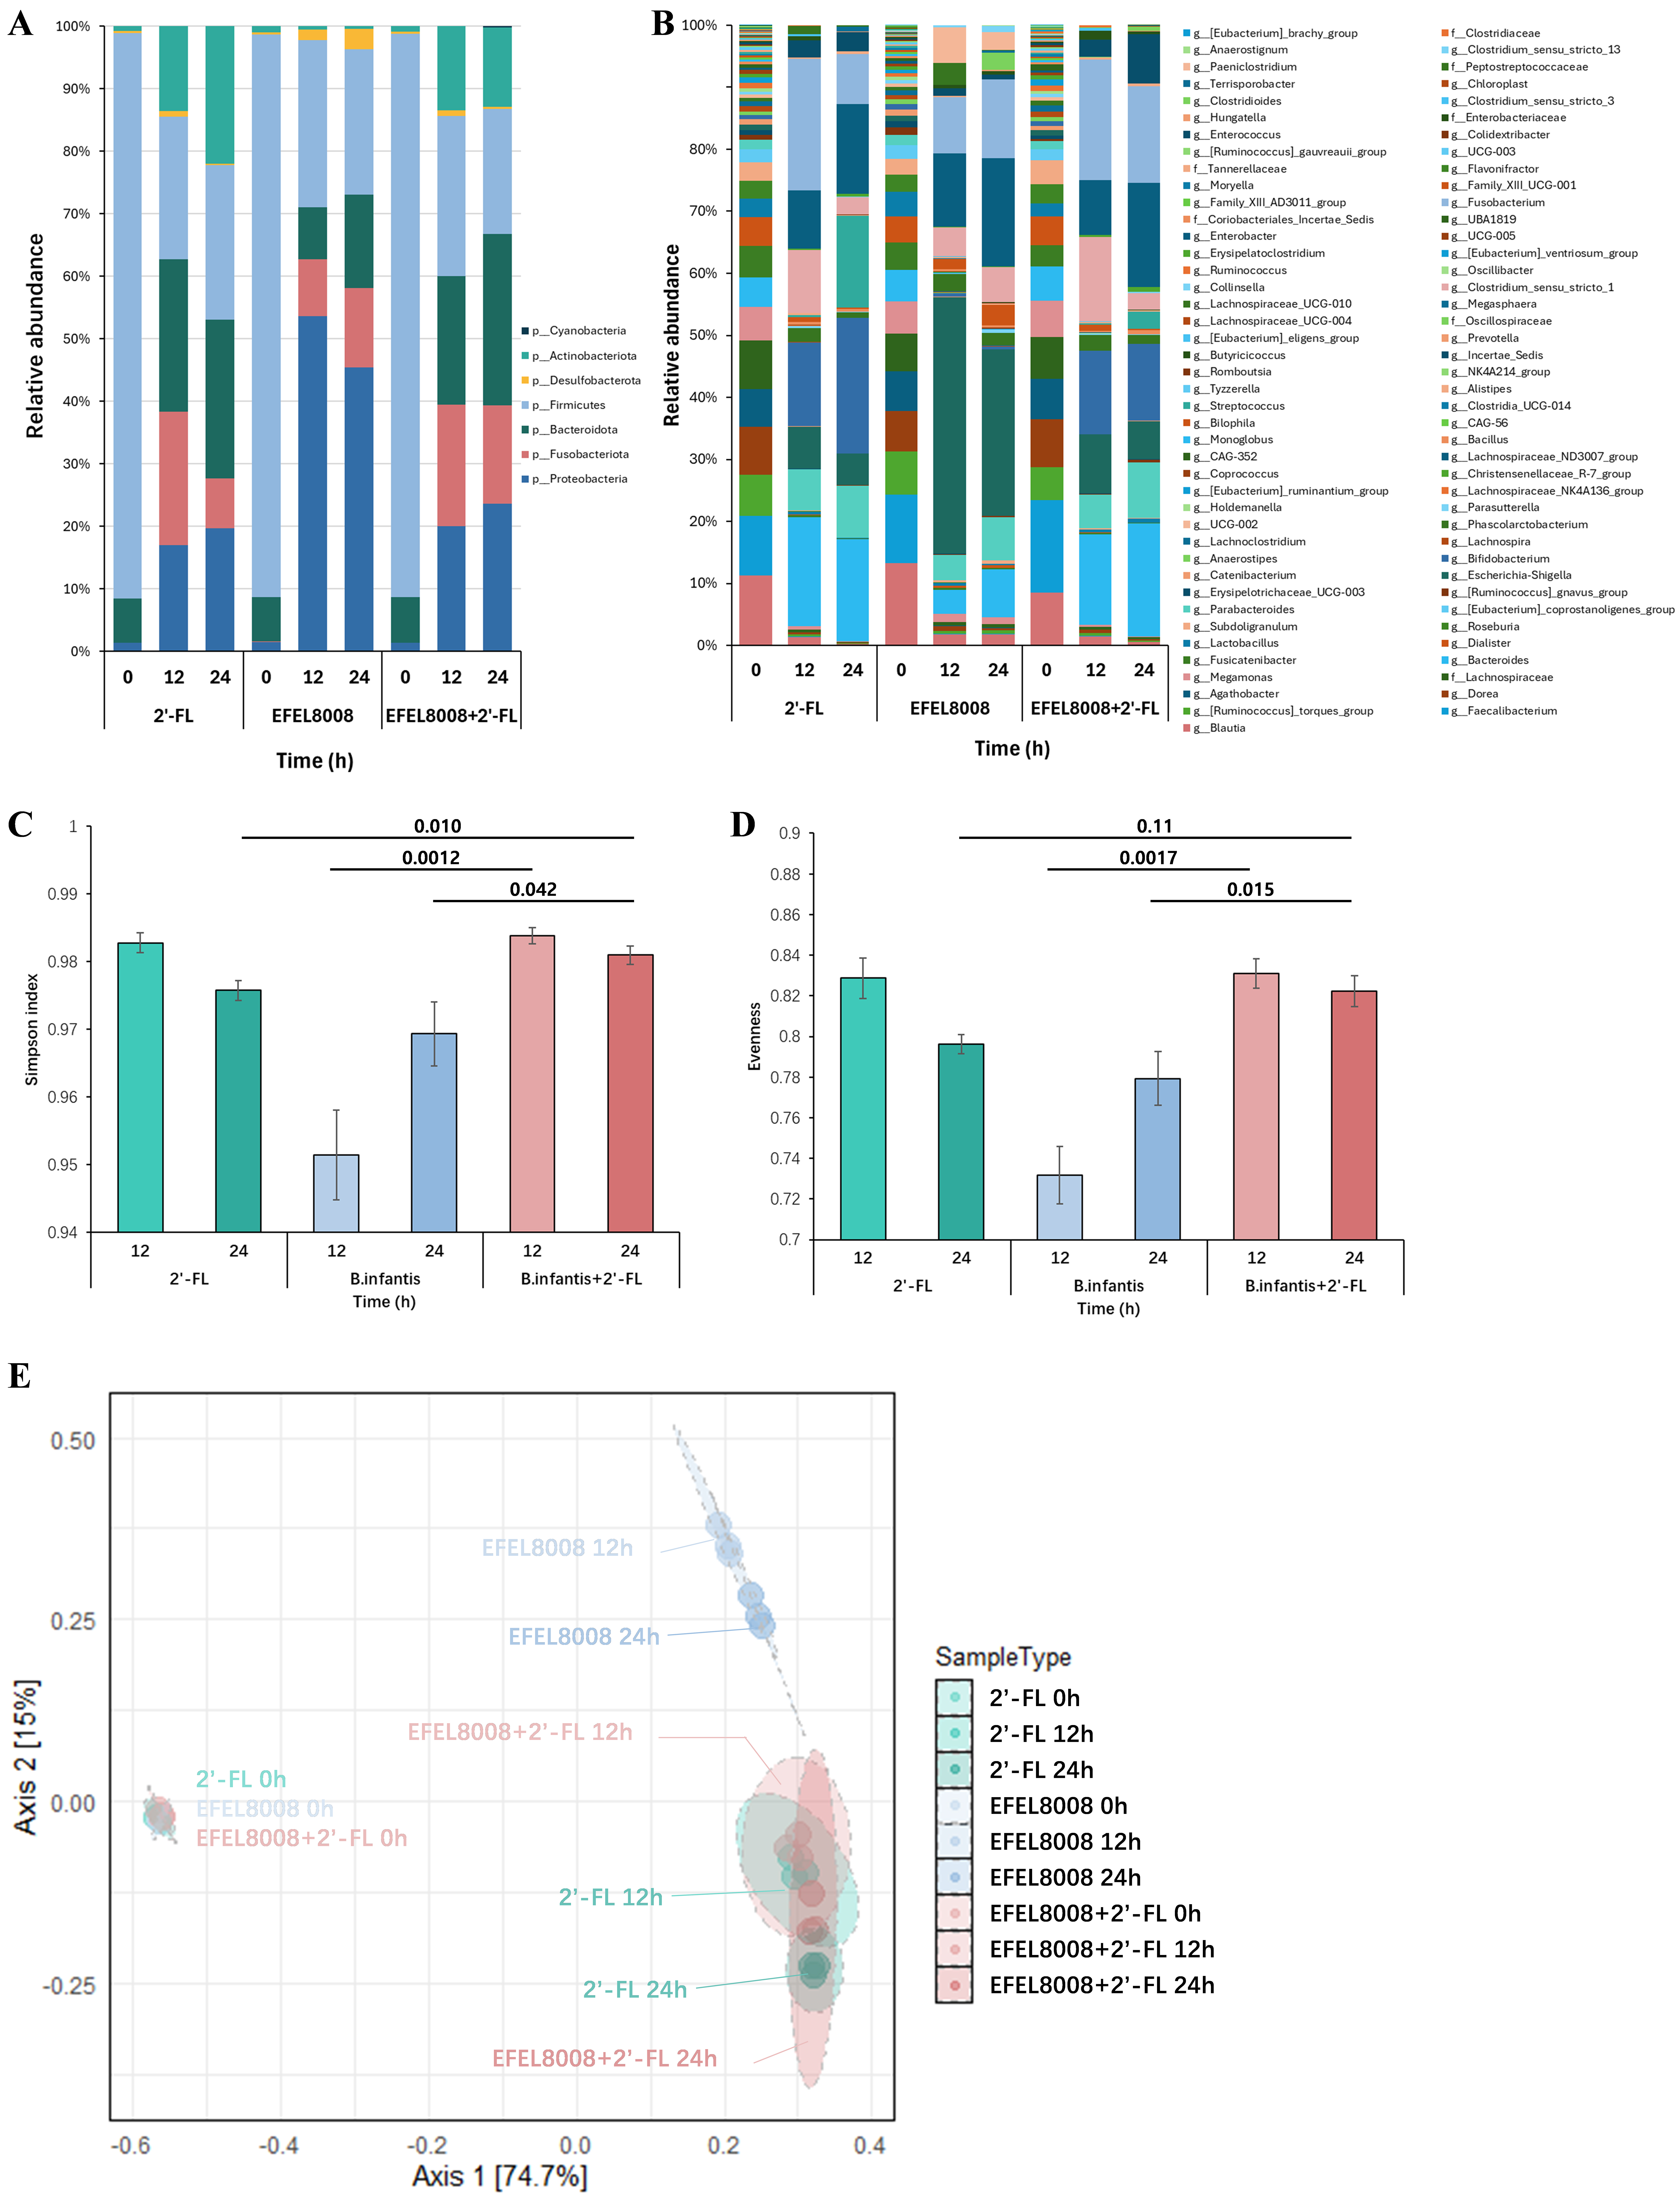
Figure 2. Microbial diversity analyses and microbial abundance profiling after in vitro fecal fermentation. Bacterial taxonomic composition at the (A) phylum and (B) genus levels; Alpha diversities of (C) Simpson Index and (D) evenness, with error bars representing the standard deviation from the mean (n = 3). Significant differences between groups are indicated by P-values; (E) PCoA plot of microbial communities based on Bray-Curtis distance in two dimensions. 2′-FL, addition of 1% (w/v) 2′-fucosyllactose; EFEL8008, addition of B. infantis EFEL8008 at 3.51 × 10⁶ CFU/mL; EFEL8008 + 2′-FL, addition of B. infantis EFEL8008 at 3.51 × 10⁶ CFU/mL and 1% 2′-FL. PCoA: Principal coordinate analysis; 2′-FL: 2′-fucosyllactose; B. infantis: Bifidobacterium longum subsp. infantis.


