


fig6
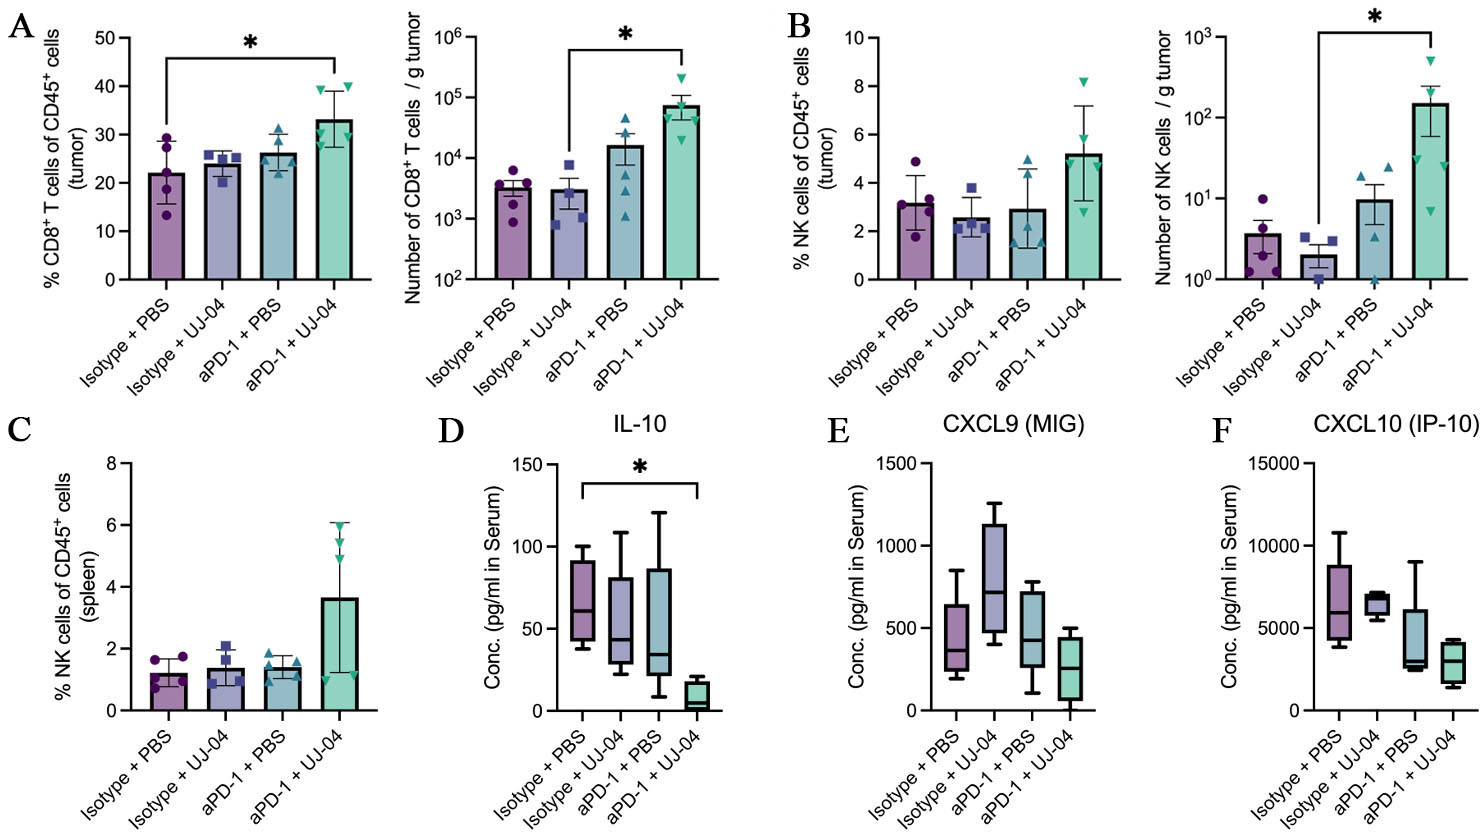
Figure 6. Immune profiling at the experimental endpoint. (A) Frequency of CD8+ T cells among CD45+ tumor cells, and absolute number of CD8+ T cells per gram of tumor; (B) Frequency of NK cells among CD45+ tumor cells, and absolute number of NK cells per gram of tumor; (C) Frequency of NK cells among CD45+ splenic cells; (D) Serum IL-10 concentrations measured by multiplex bead-based assay and presented as median with min-to-max whiskers (pg/mL); (E) Serum CXCL9 concentrations measured by multiplex bead-based assay and presented as median with min-to-max whiskers (pg/mL); (F) Serum CXCL10 concentrations measured by multiplex bead-based assay and presented as median with min-to-max whiskers (pg/mL). Statistical comparisons were performed using one-way ANOVA with Tukey’s multiple-comparison test or, where appropriate, the Kruskal-Wallis test with Dunn’s correction. Exact P values and significance annotations are indicated in the panels. *, P < 0.05. PBS: Phosphate-buffered saline; UJ-04: four-strain consortium; aPD-1: anti-programmed cell death protein 1 antibody; IL-10: interleukin 10; MIG: monokine induced by gamma interferon; IP-10: interferon gamma-induced protein 10; NK: natural killer; CXCL: C-X-C motif chemokine ligand; ANOVA: analysis of variance.


