


fig8
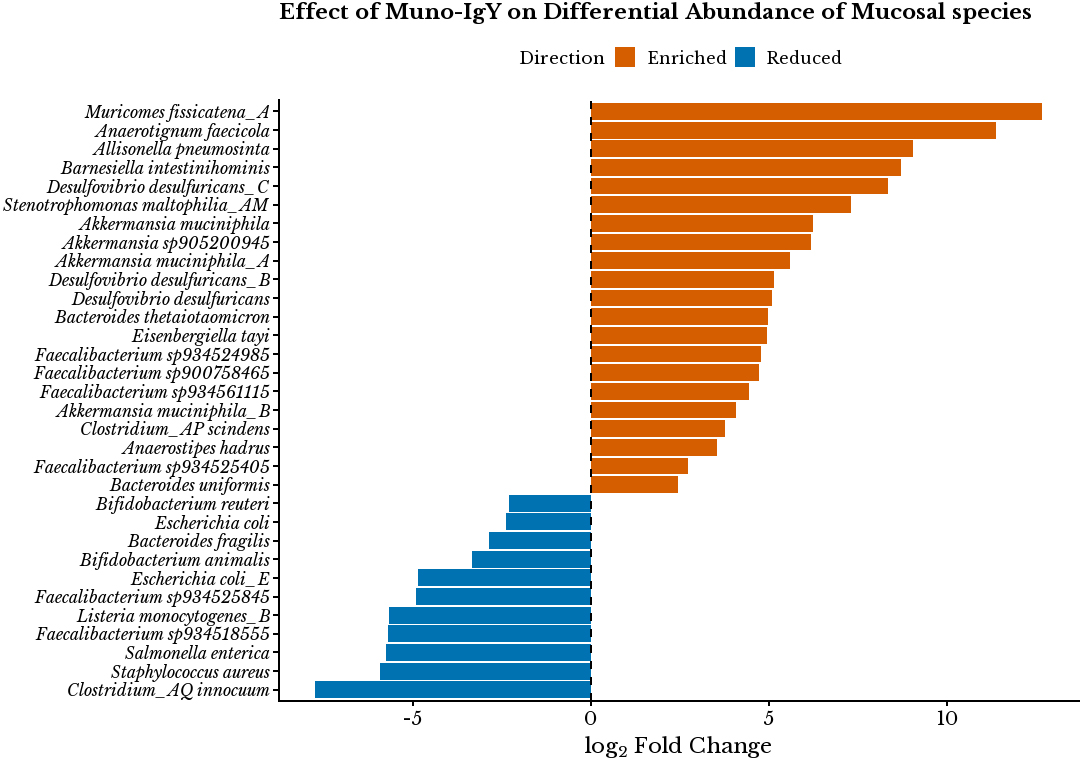
Figure 8. Differential abundance of selected microbial species in the mucosal compartment. log2FC values were calculated as the ratio of mean relative abundance in the Muno-IgY® group relative to the control. Positive log2FC values indicate enrichment in the Muno-IgY® group, whereas negative values indicate depletion relative to Control. Findings are interpreted as descriptive shifts rather than inferential outcomes. IgY: Immunoglobulin Y; log2FC: log2 fold change.


