

fig5
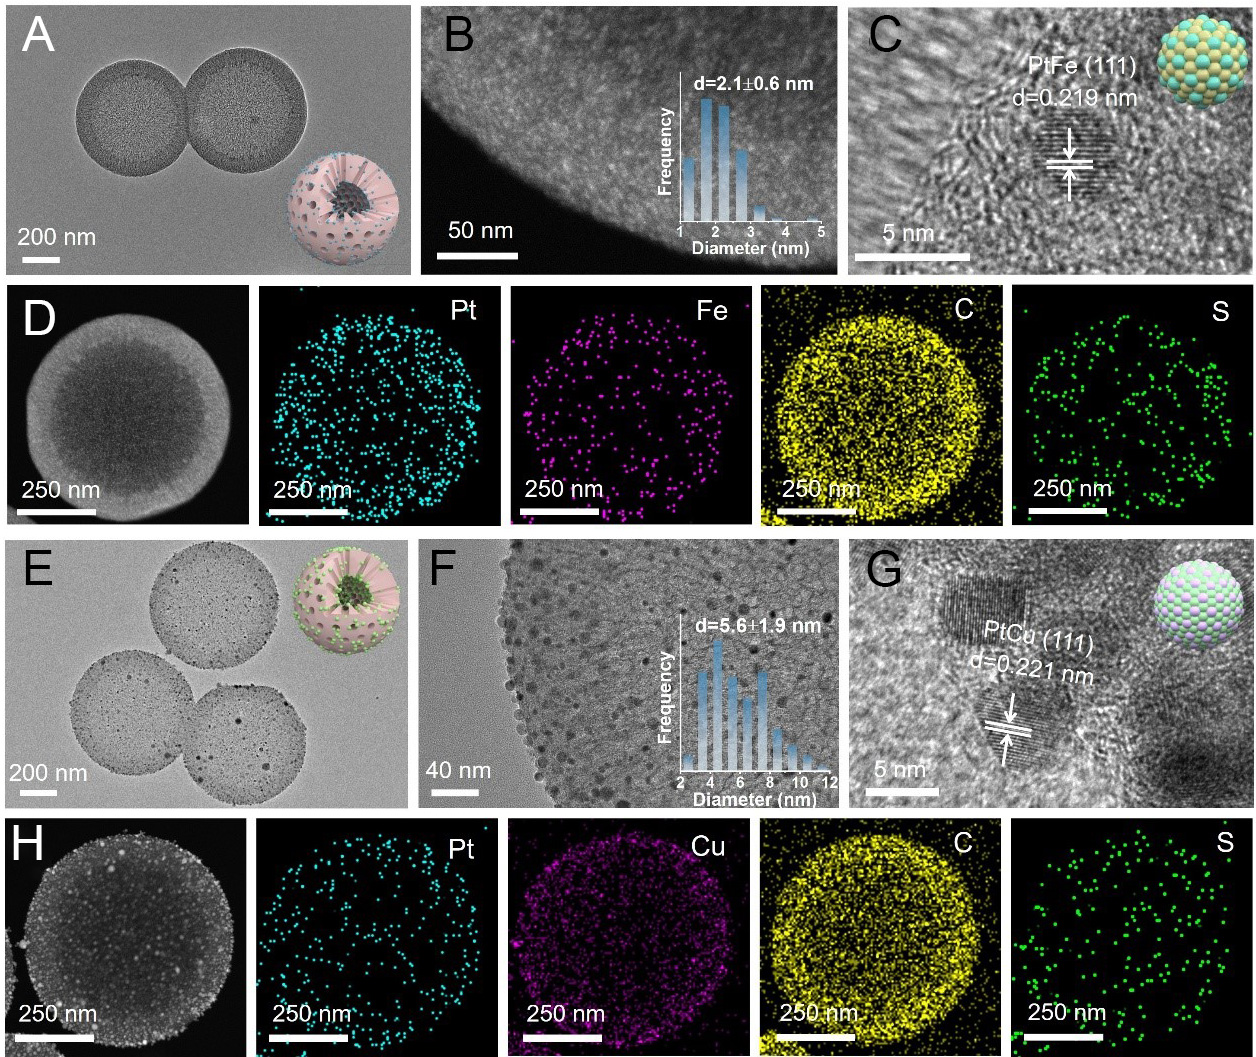
Figure 5. Microscopic characterization of PtFe–S/MCS and PtCu–S/MCS. (A) TEM image; (B) HAADF-STEM image with the inset showing the size distribution of metal clusters; and (C) HRTEM image; (D) HAADF-STEM image and the corresponding EDS elemental mappings of PtFe–S/MCS; (E and F) TEM images with the inset showing the size distribution of metal clusters; and (G) HRTEM image, (H) HAADF-STEM image and the corresponding EDS elemental mappings of PtCu–S/MCS. MCS: Mesoporous carbon nanospheres; HAADF-STEM: high-angle annular dark-field scanning transmission electron microscopy; HRTEM: high resolution transmission electron microscopy; EDS: energy-dispersive X-ray spectroscopy; TEM: transmission electron microscopy.

