

fig5
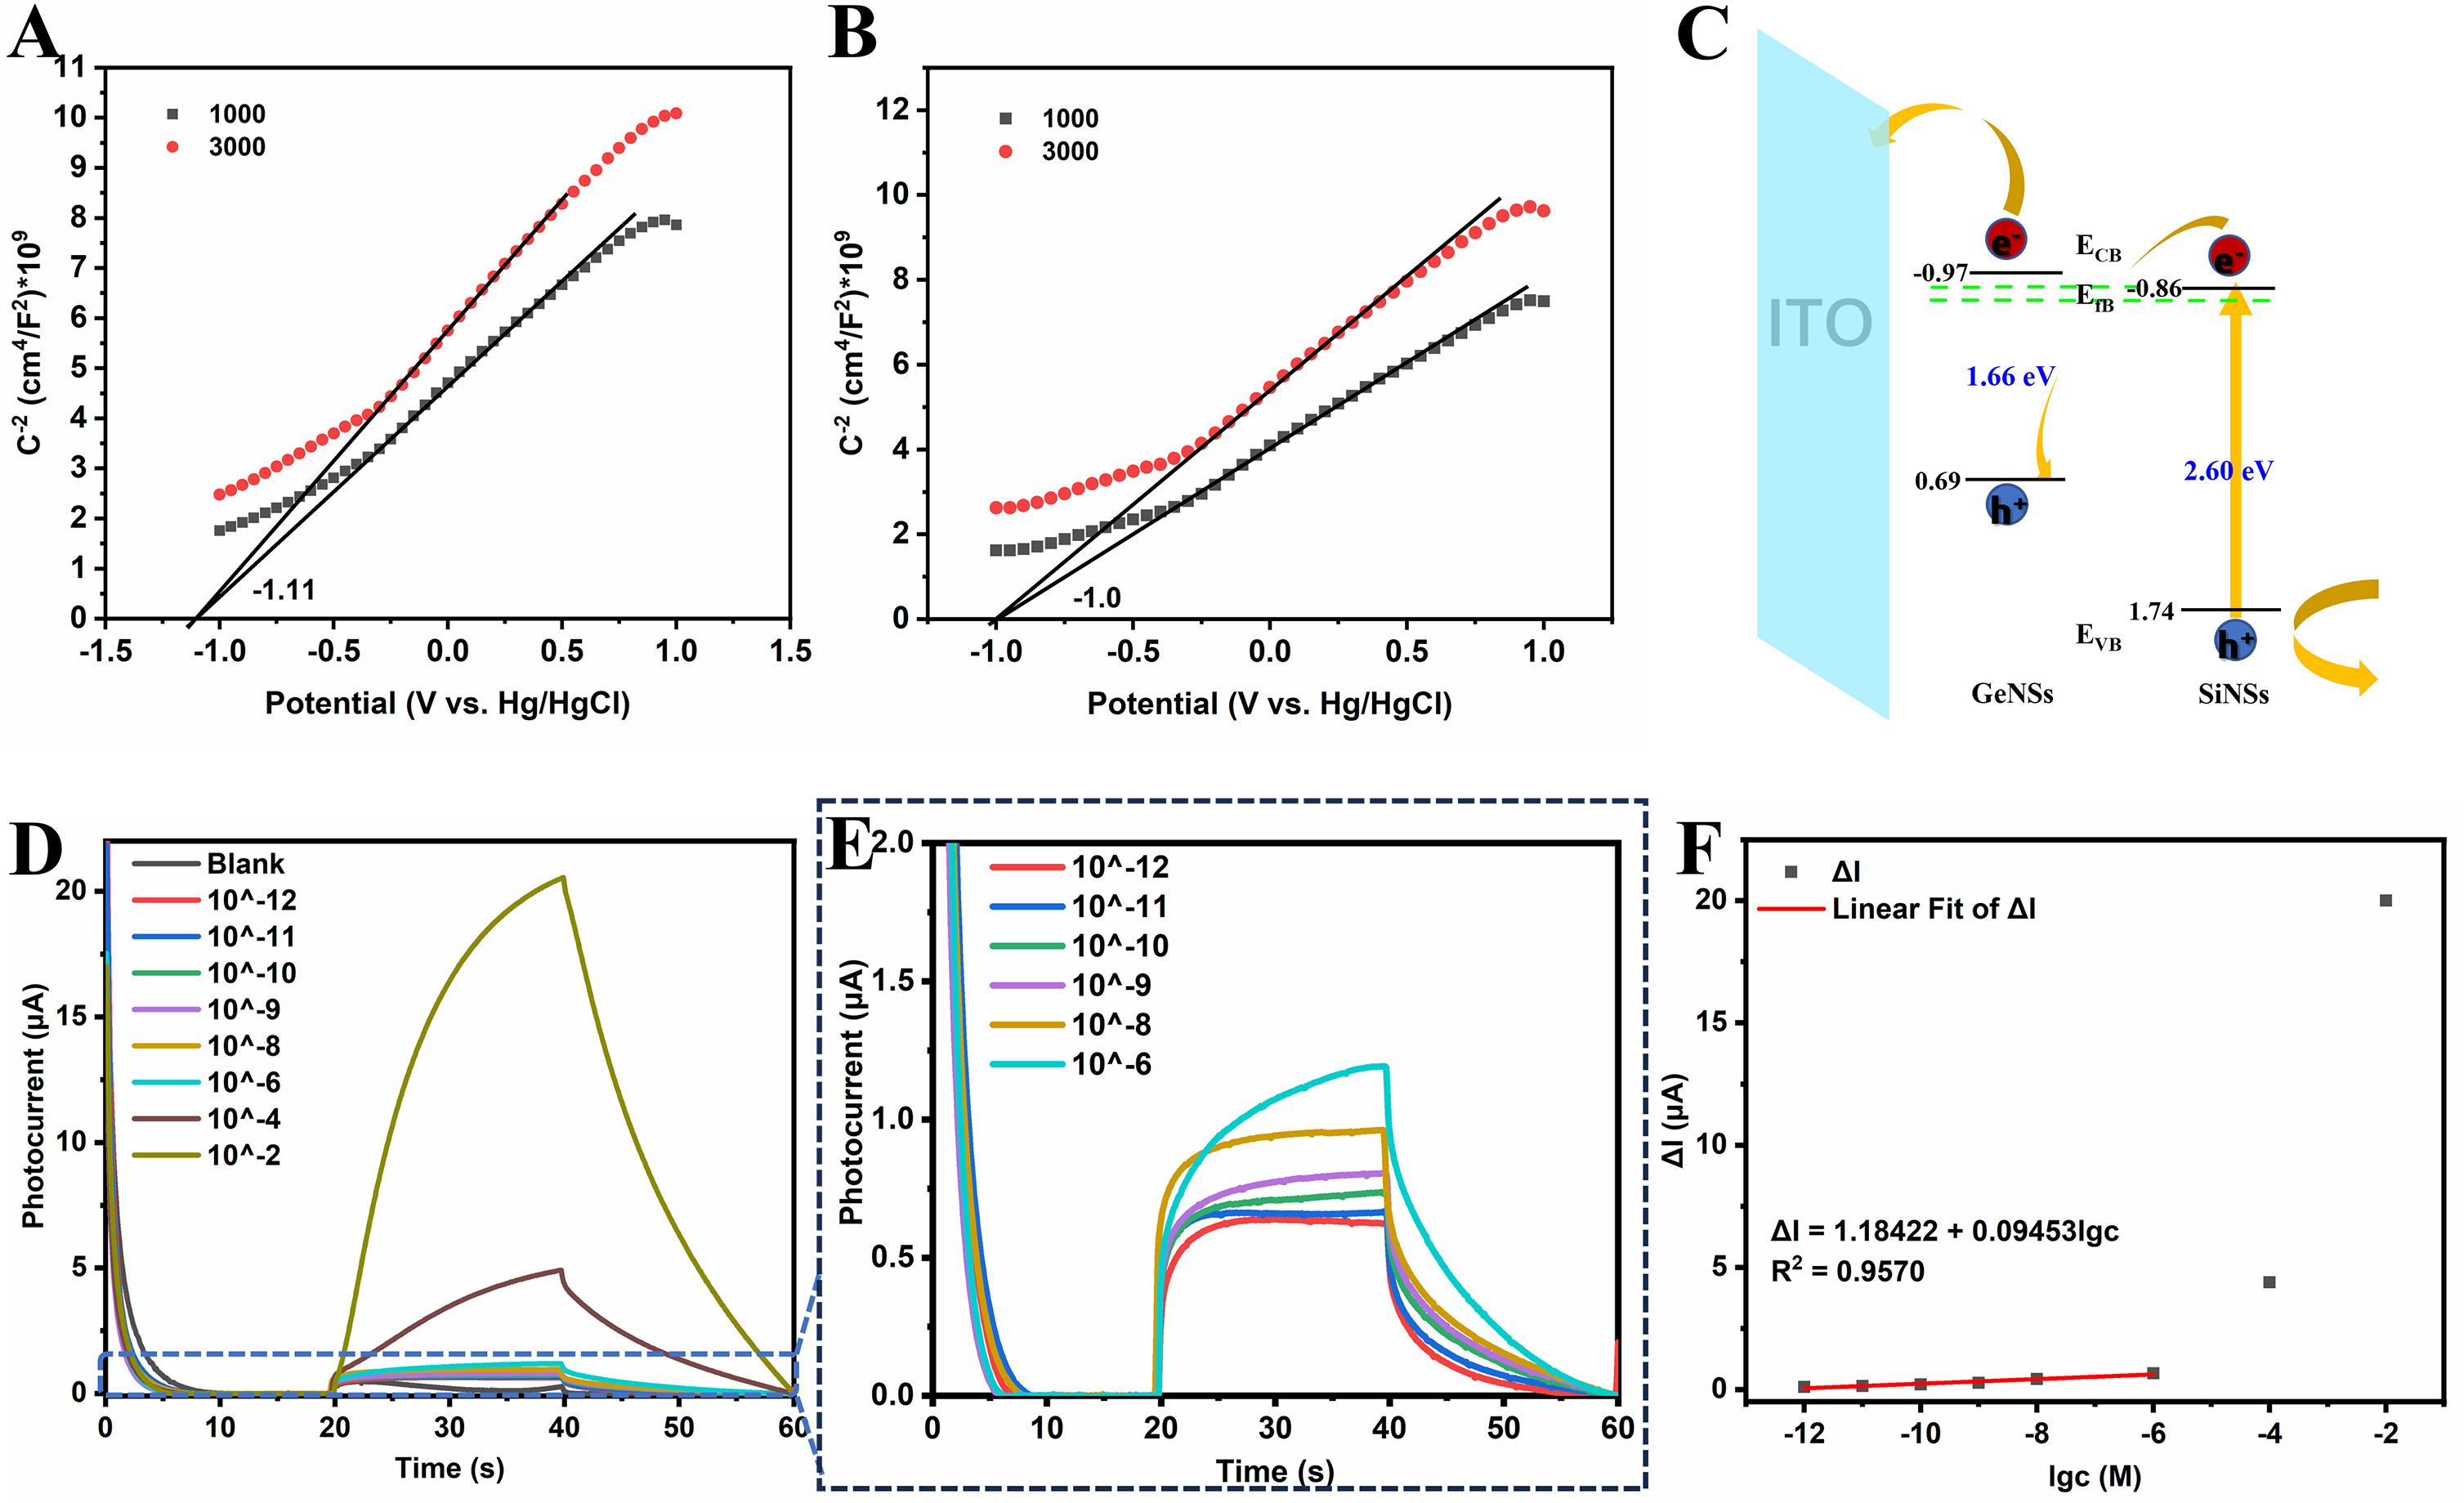
Figure 5. (A) Mott-Schottky curve of GeNSs; (B) Mott-Schottky curve of SiNSs; (C) Energy level structures of GeNSs and SiNSs. (D) Photocurrent responses of the electrode with different concentrations of tartrazine under 520 nm illumination (Level III) and a bias potential of 0.3 V. (E) Photocurrent responses of the electrode with tartrazine concentrations of 10-12, 10-11, 10-10, 10-9, 10-8, and 10-6 M. (F) A scatter plot and fitted line of photocurrent vs. log of tartrazine concentration.





