




fig7
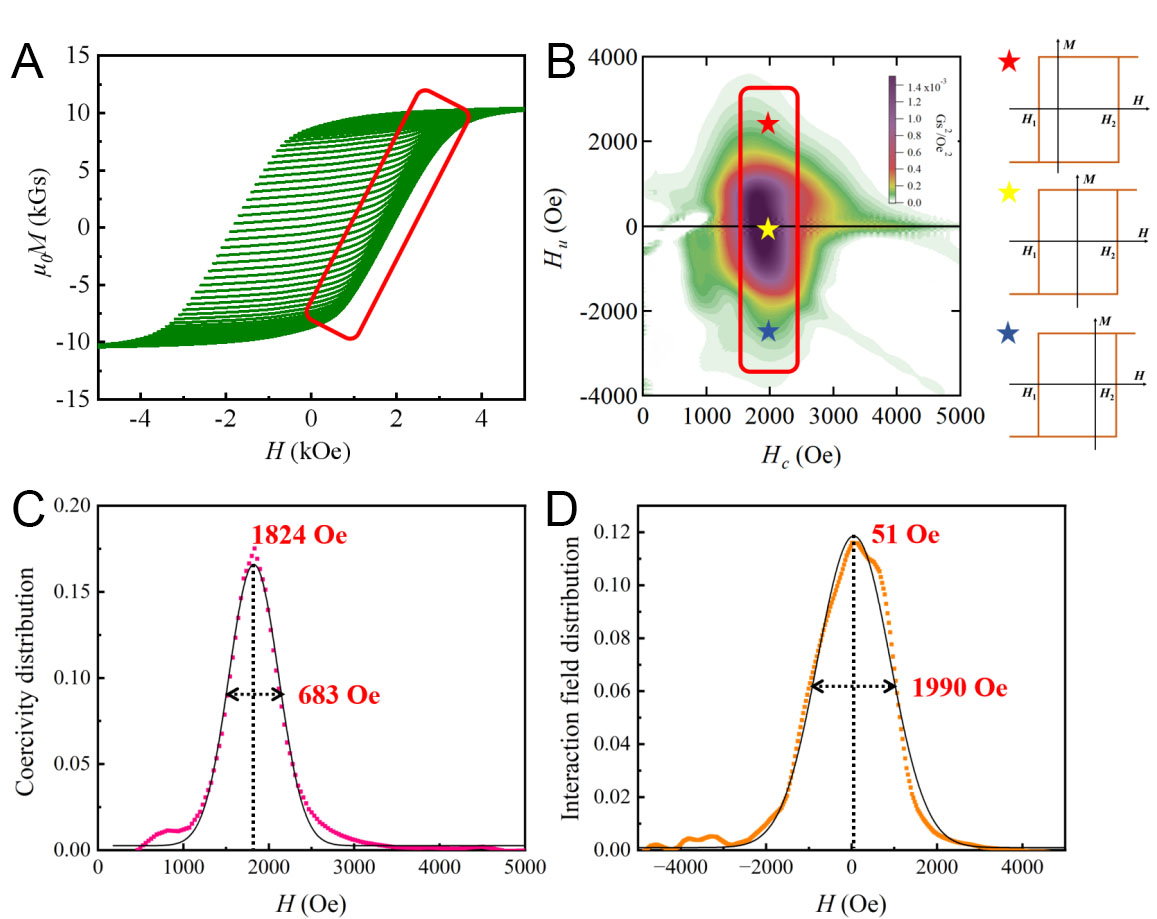
Figure 7. First-order reversal curve (FORC) analysis of the Alnico 8 magnet. (A) Measured FORC family, with the region of interest highlighted by the red rectangle; (B) FORC contour plot, where the color scale represents the FORC distribution intensity; (C) Coercivity distribution derived from the FORC diagram (D) Interaction field distribution derived from the FORC diagram.





