


fig7
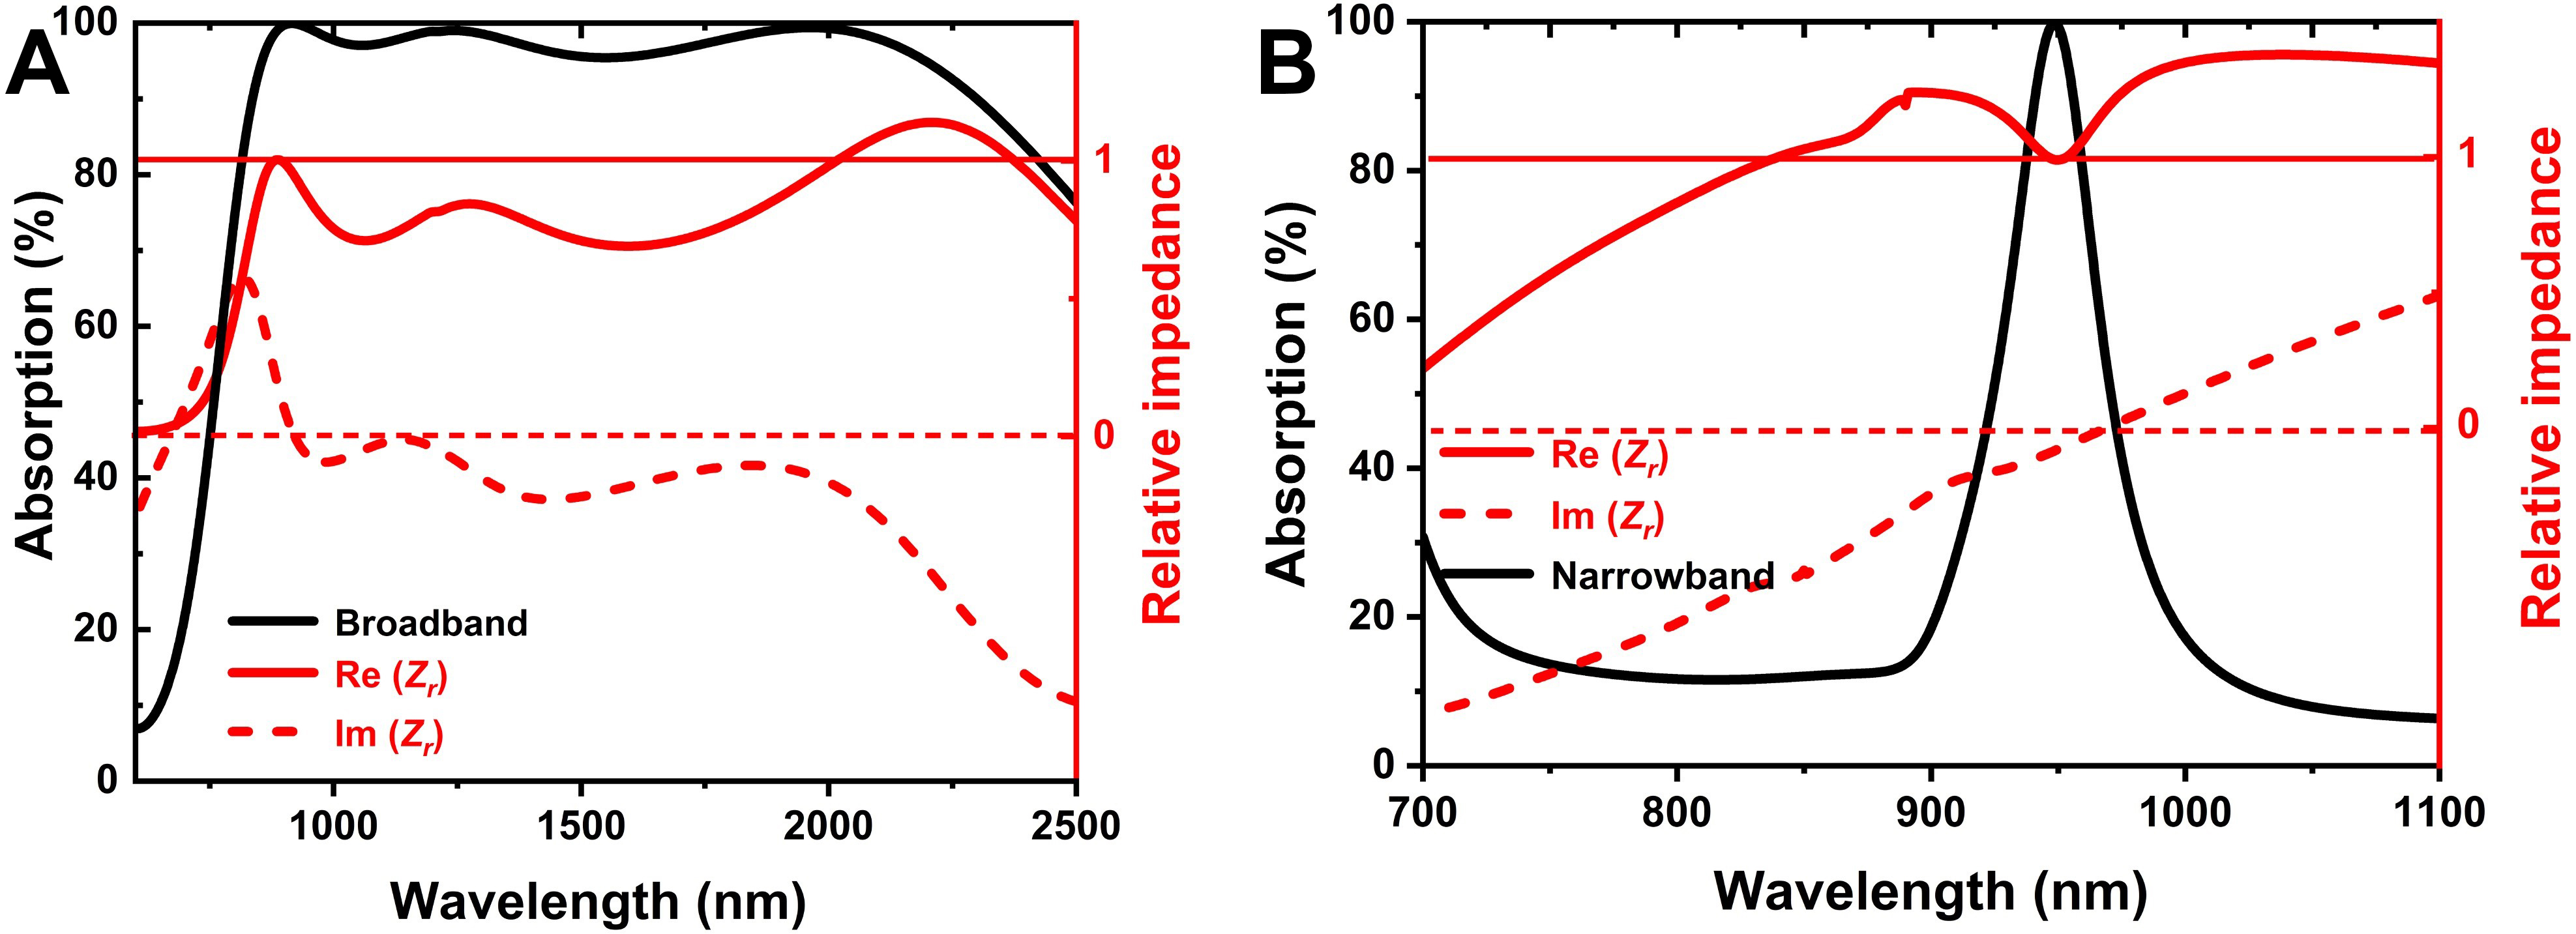
Figure 7. The corresponding relative impedance response of broadband absorption (A) and narrowband absorption (B), where the left axis represents the absorption spectra, while the right axis displays the relative impedance of the metamaterial: real part Re(Zr) (solid red line) and imaginary part Im(Zr) (dashed red line).


