
fig4
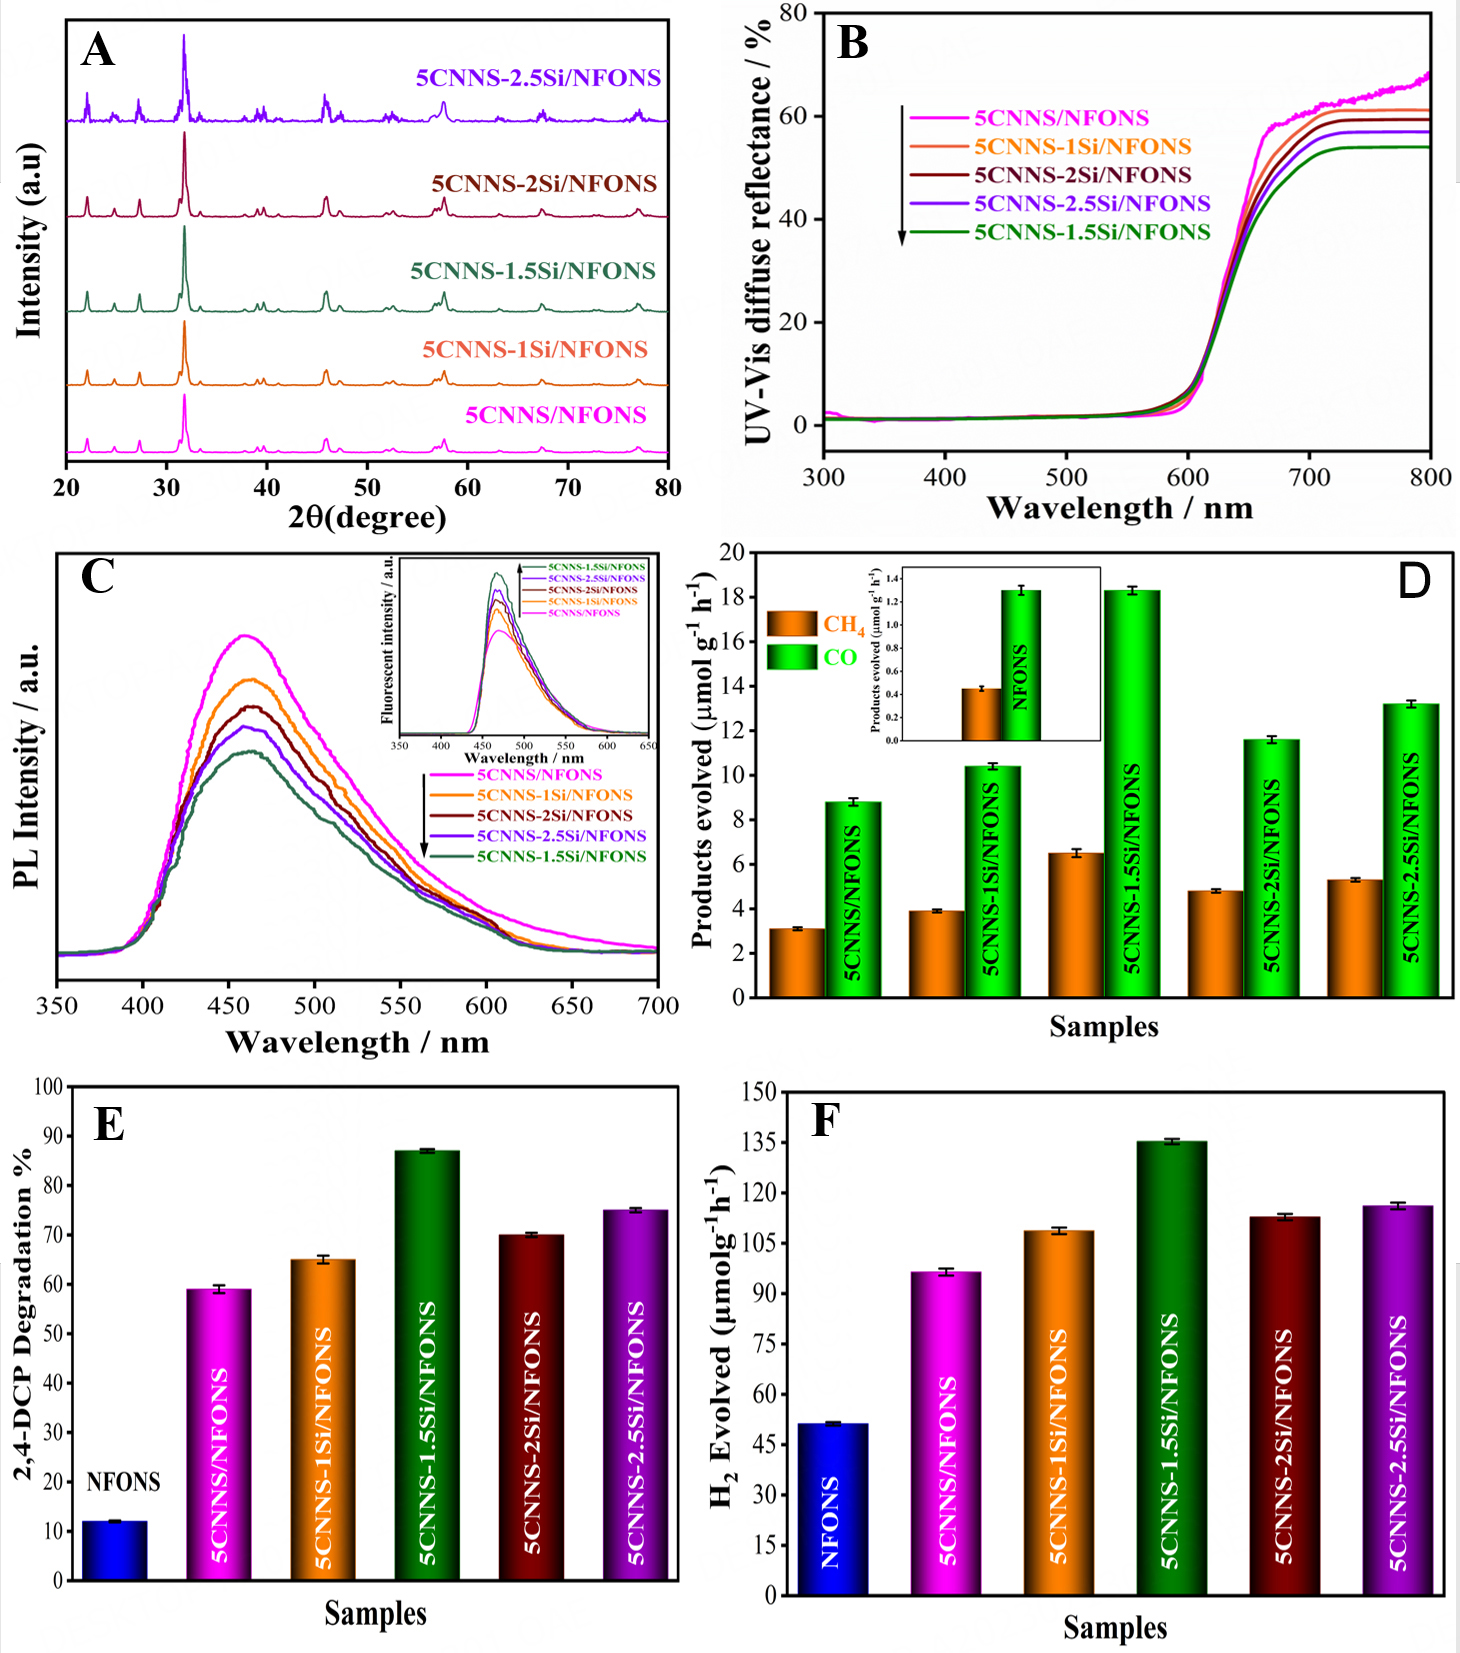
Figure 4. XRD patterns (A), UV-Vis diffuse reflectance spectra (B), PL emission spectra with FS inset spectra (C), and photocatalytic activities for CO2 conversion (D), 2,4-DCP degradation (E), and H2 evolution (F) of pristine NFONS and 5CNNS-YSi/NFONS. Error bars in (D-F) represent the standard deviation of four independent measurements (n = 4).