




fig7
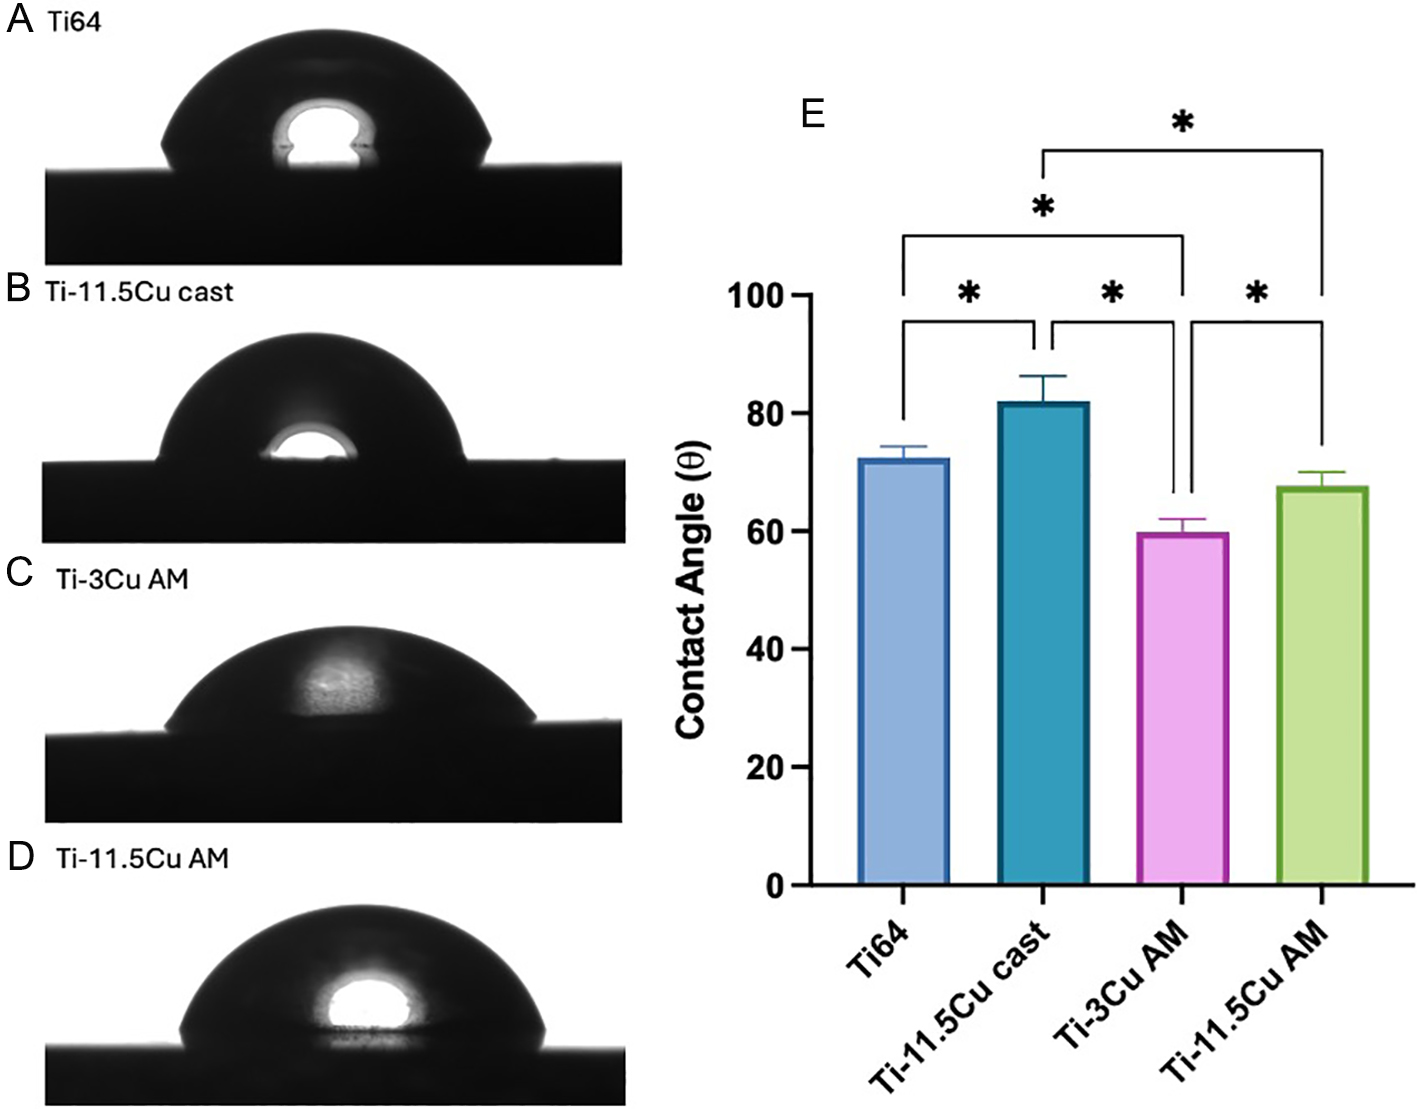
Figure 7. Images of water droplets on (A) Ti64, (B) Ti-11.5Cu as cast, (C) Ti-3Cu and (D) Ti-11.5Cu surfaces. With a summary of numerical data presented in (E) highlighting the significantly lower CA for Ti-3Cu compared with both the AM Ti-11.5Cu and as-cast sample and Ti-6Al-4V (n = 5), *P < 0.05. This figure is reprinted with permission[21].





