


fig3
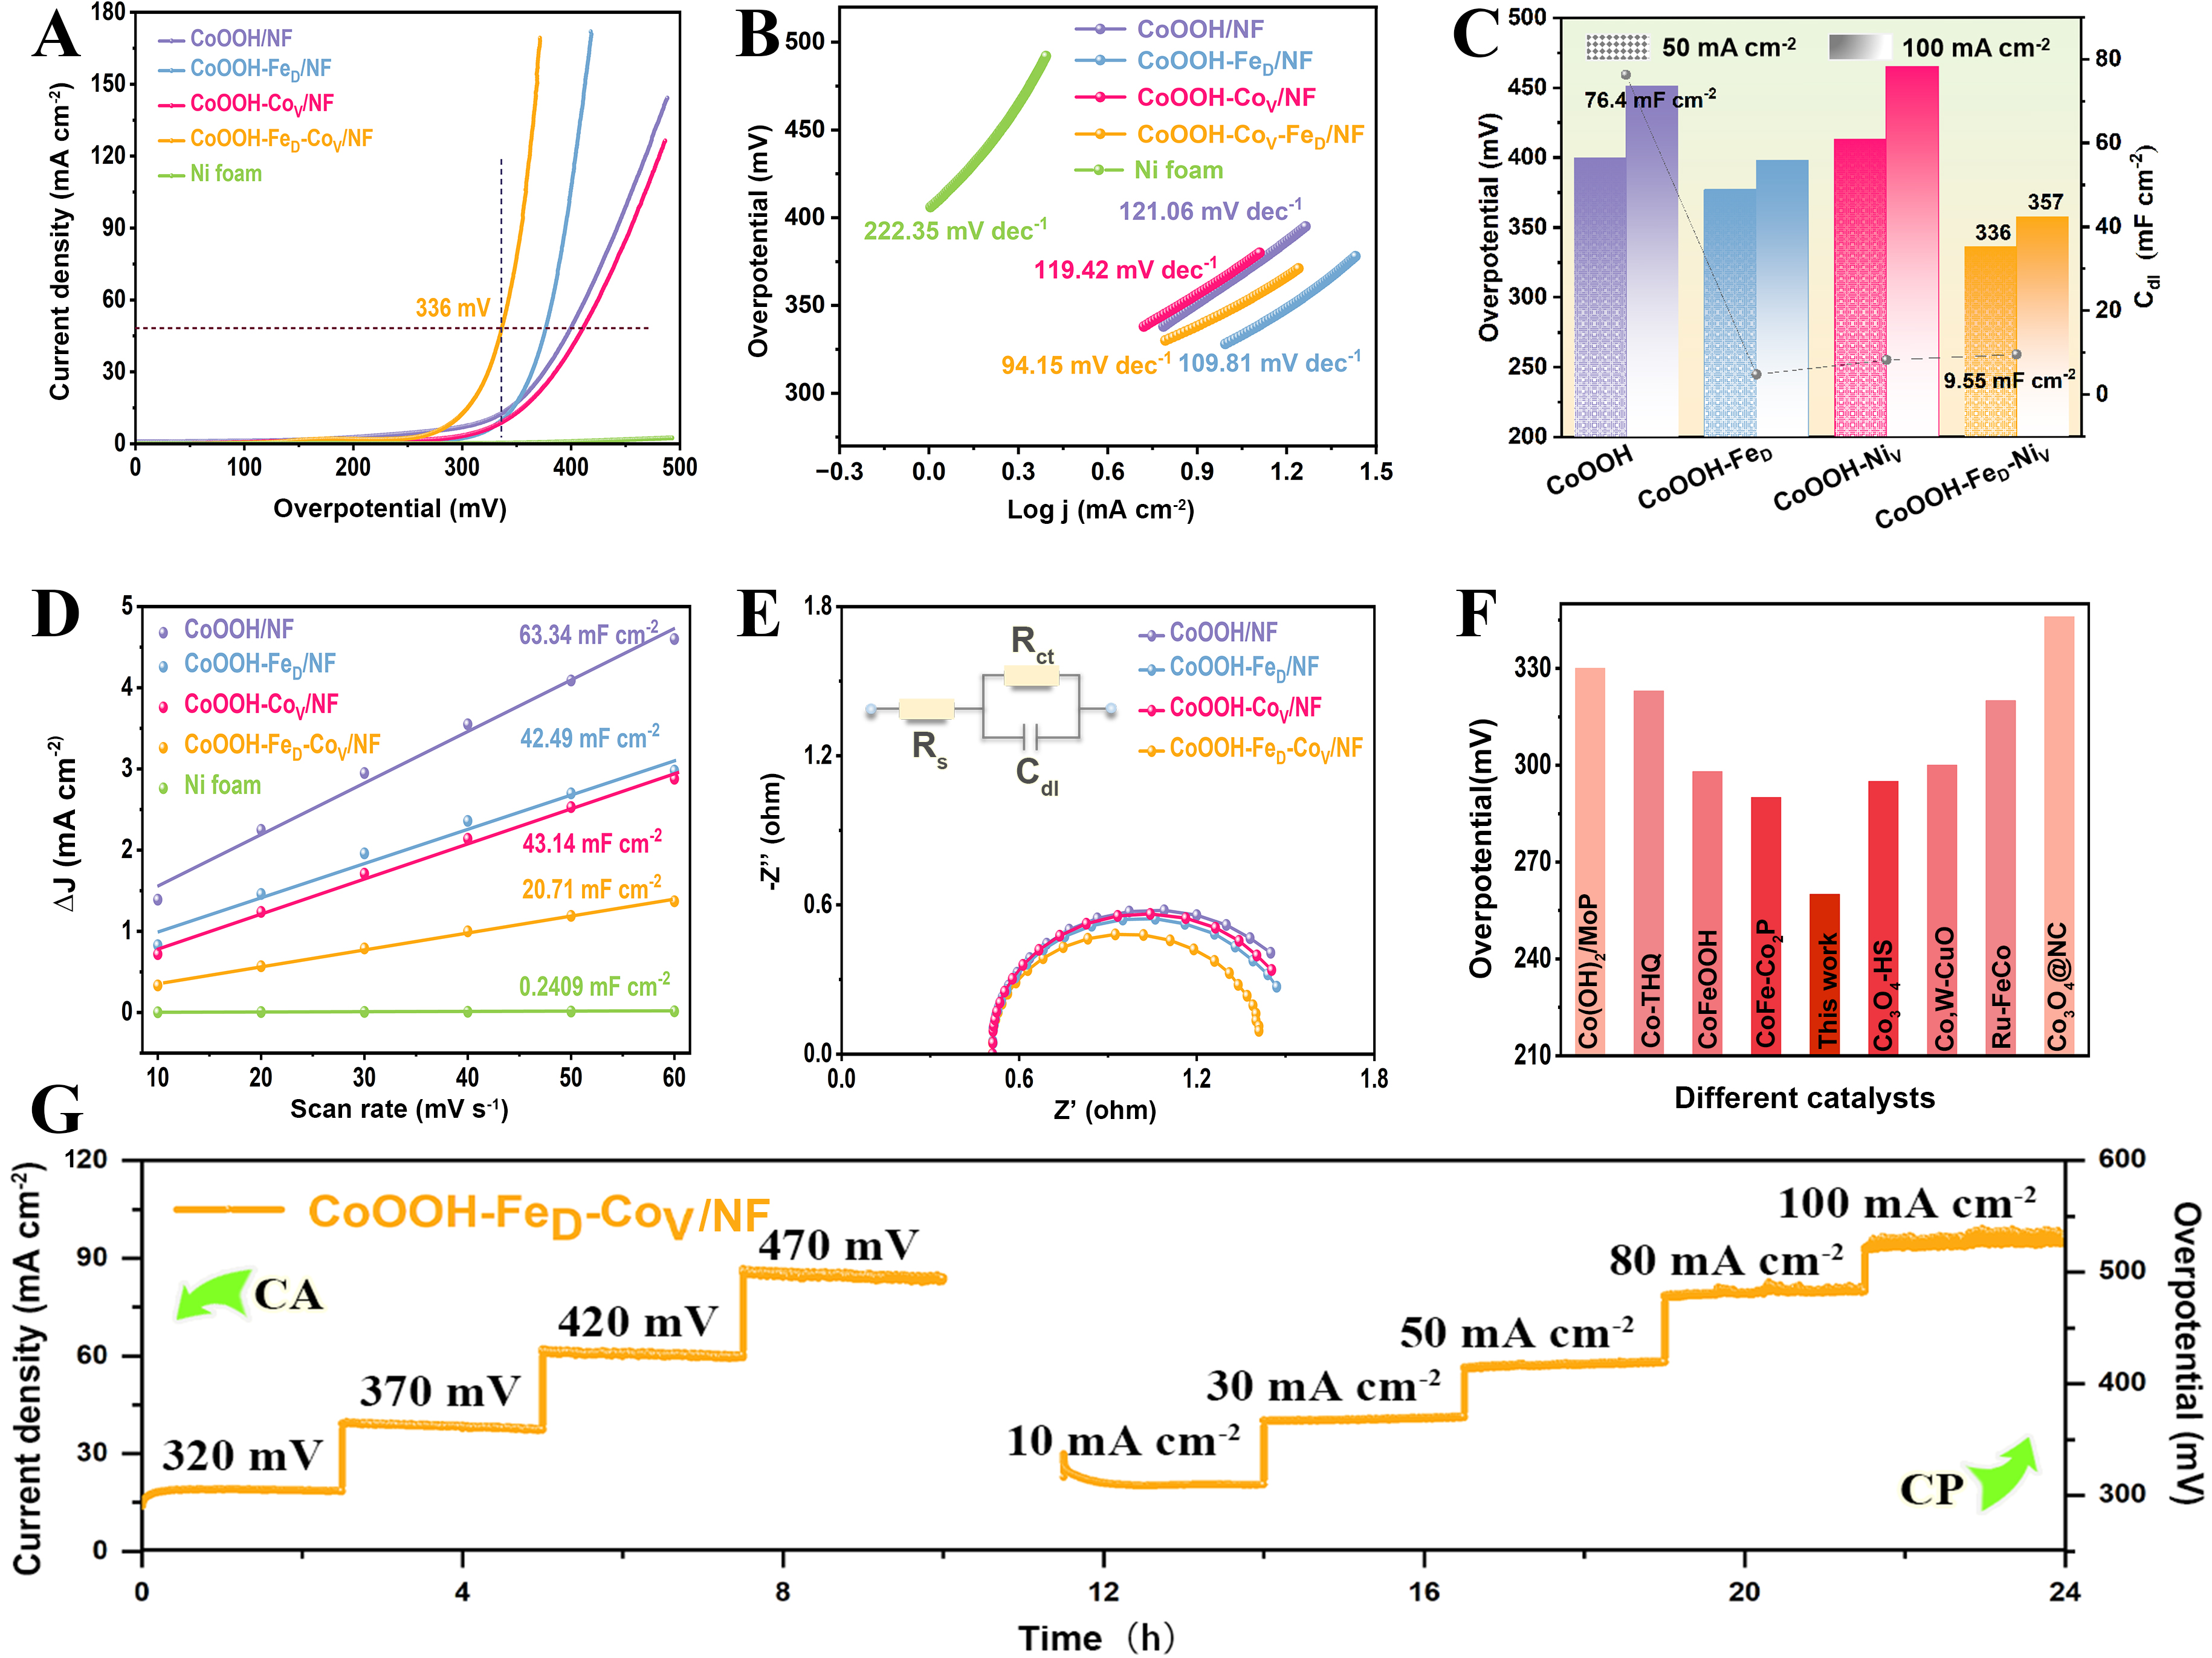
Figure 3. Evaluation of OER catalytic activity. (A) LSV curves with 80% iR correction; (B) Tafel plots generated from low-overpotential polarization data; (C) Overpotentials at j = 50 mA cm-2 and 100 mA cm-2 (left y-axis), along with the Cdl values (right y-axis); (D) Relationships between the differences of current density at 0.25 V vs. Hg/HgO and scan rates; (E) Nyquist plots of different catalysts and fitted equivalent circuit diagram; (F) Comparison of overpotentials at j = 10 mA cm-2 between CoOOH-FeD-CoV/NF and other Co-based catalysts; (G) Stability assessment through multi-potential test at overpotentials of 320, 370, 420, 470 mV for 10 h, alongside multi-current test at j = 10, 30, 50, 80, 100 mA cm-2 for 13 h. NF: Nickel foam; CA: Chronoamperometry; CP: chronopotentiometry; OER: oxygen evolution reaction; LSV: linear sweep voltammetry; Cdl: double-layer capacitance; iR: current resistance.


