


fig3
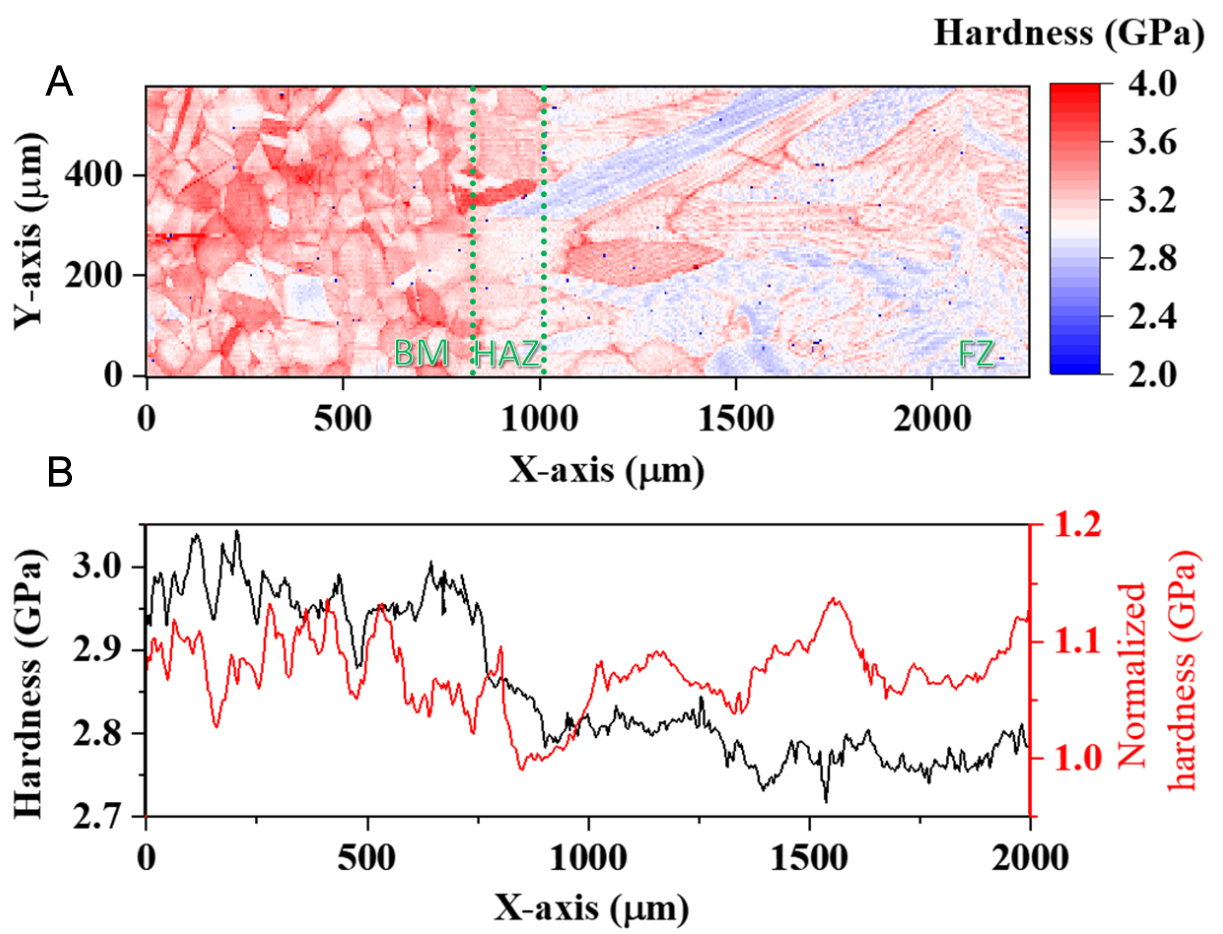
Figure 3. Hardness distribution across the three distinct regions after cyclic loading at 4.2 K: (A) hardness map; (B) average hardness and Taylor factor-normalized average hardness plotted as a function of the X position.
Figure 3. Hardness distribution across the three distinct regions after cyclic loading at 4.2 K: (A) hardness map; (B) average hardness and Taylor factor-normalized average hardness plotted as a function of the X position.


All published articles are preserved here permanently:
https://www.portico.org/publishers/oae/


