


fig6
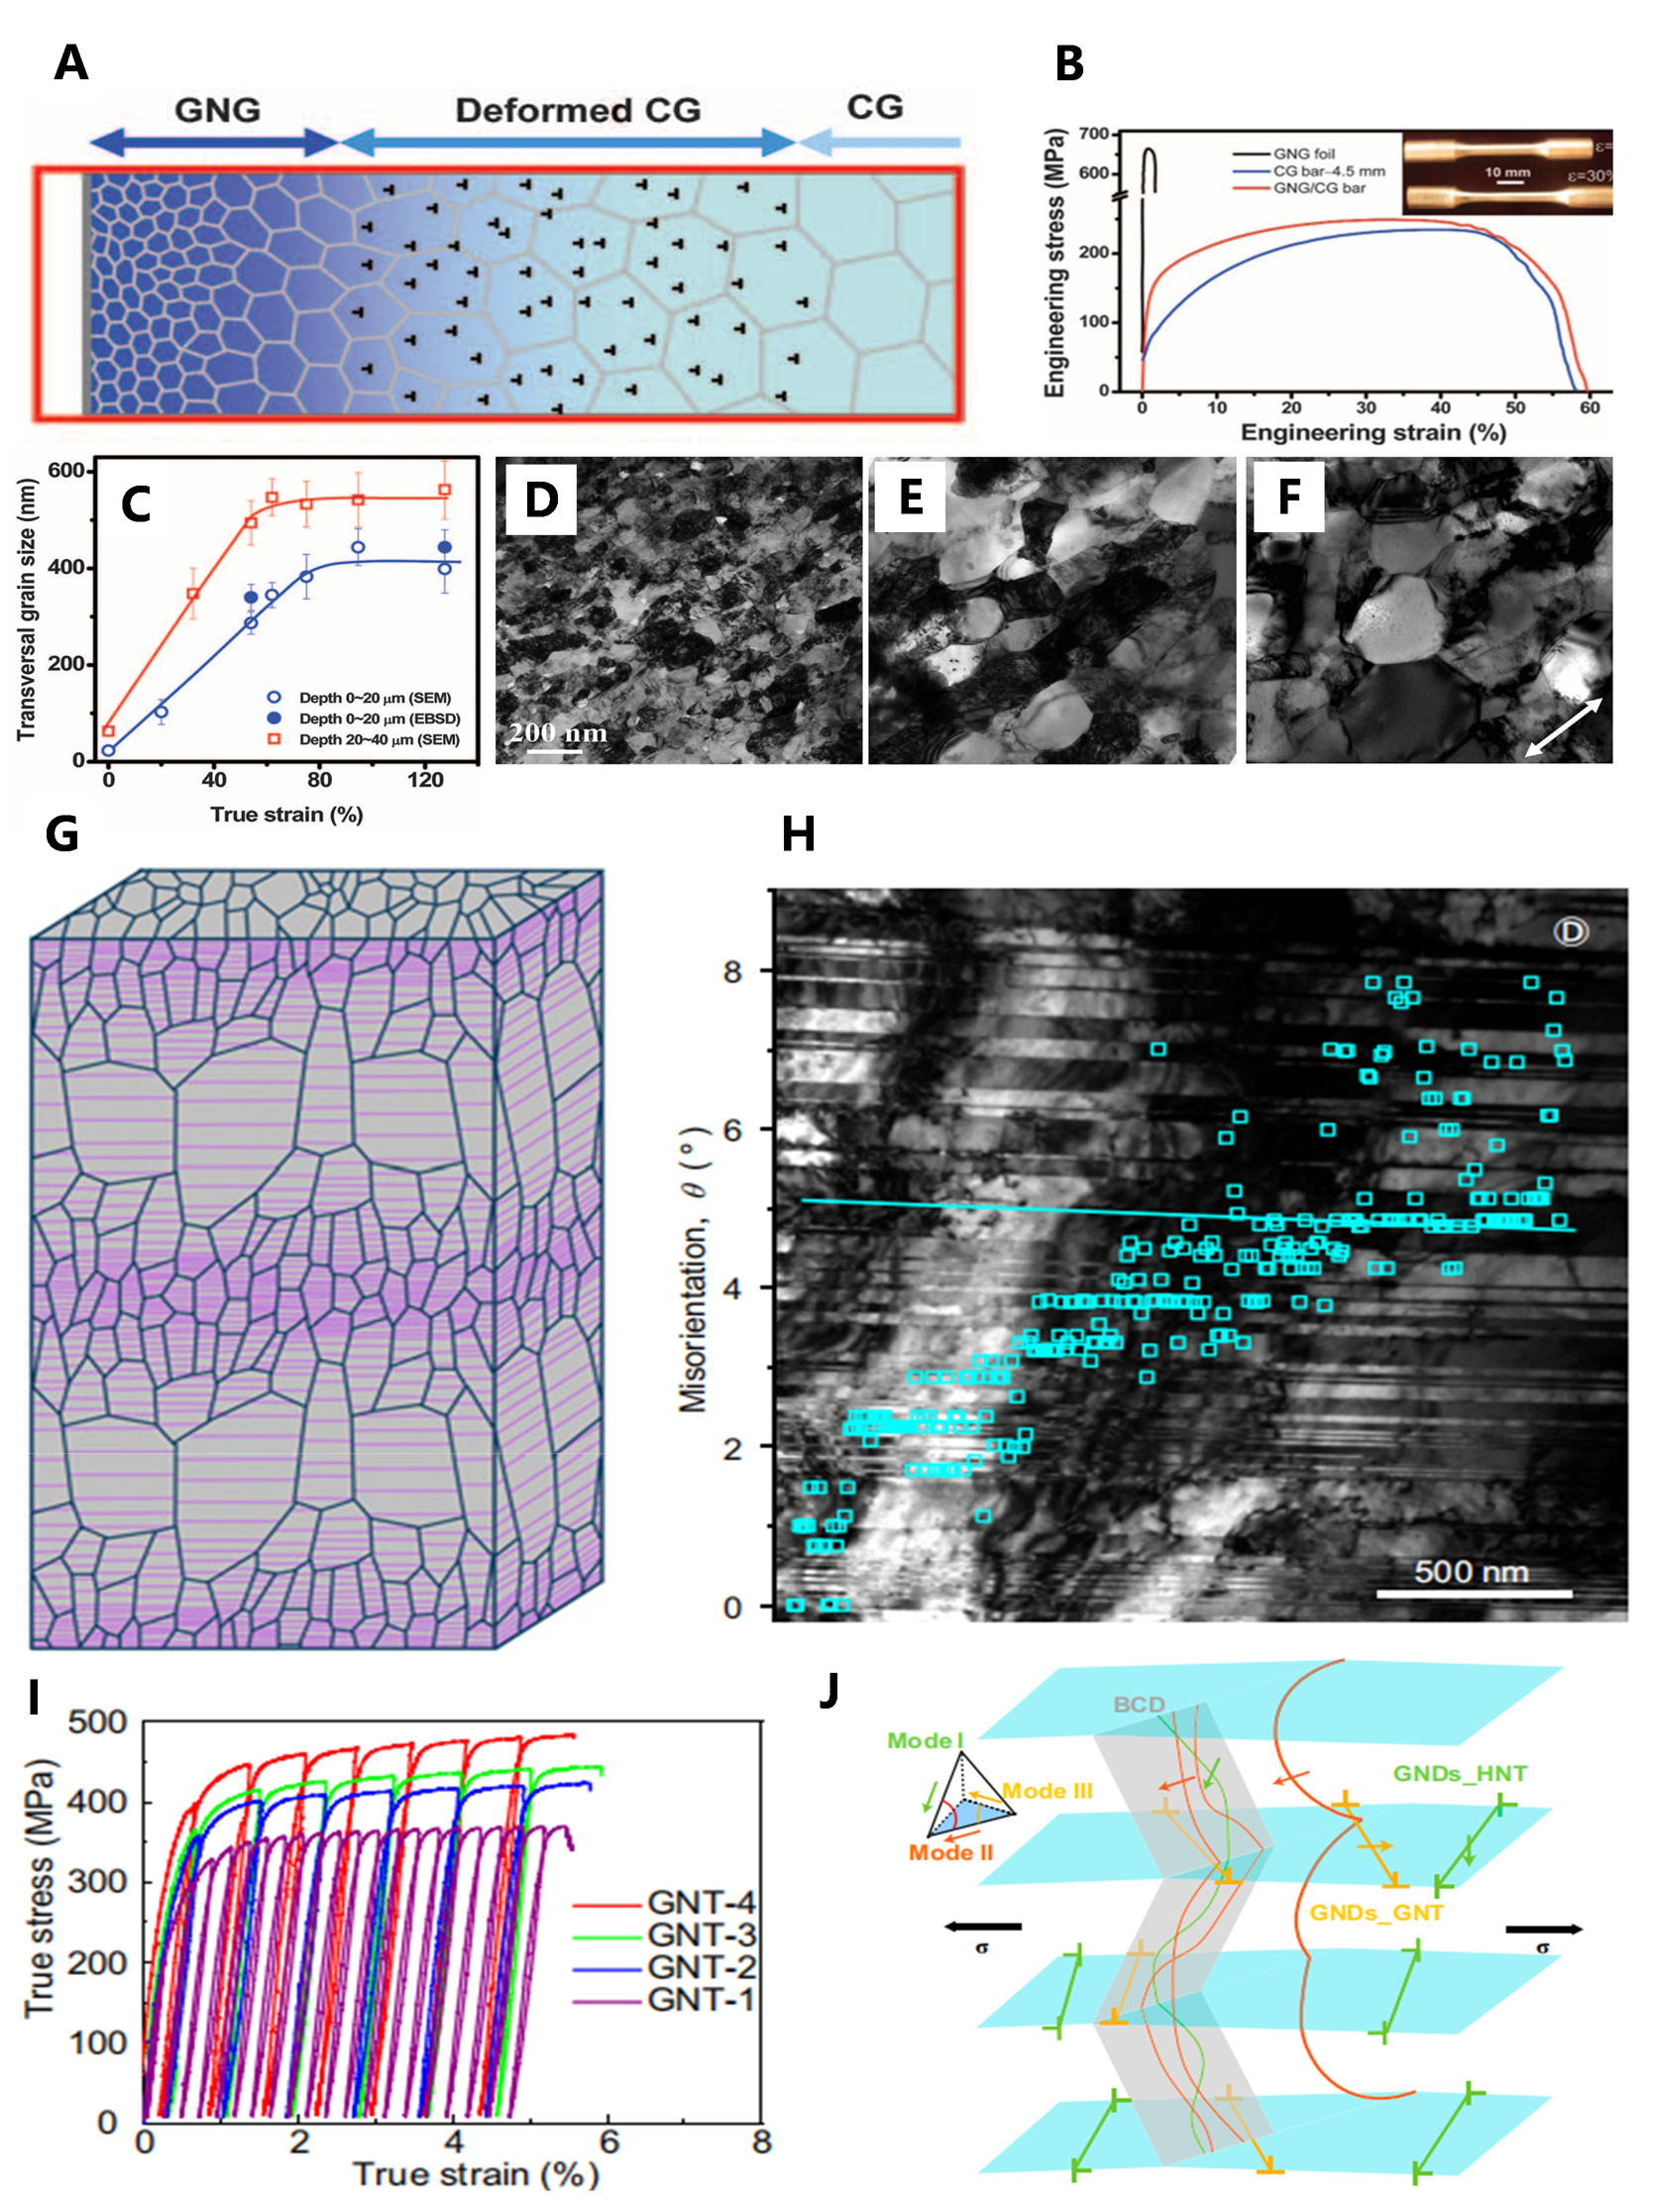
Figure 6. Deformation mechanisms in gradient nanostructured copper alloys, (A-F) GNG Cu alloy[19,73] (Reprinted from Ref.[19], with permission from American Association for the Advancement of Science; Reprinted from Ref.[73], with permission from Elsevier). (G-J) GNT Cu alloy[35]. (Quoted with permission from Cheng et al.[35], under the CC BY-NC-ND 4.0 license, https://creativecommons.org/licenses/by-nc-nd/4.0/). (A) GNG structure model. (B) Quasi-static tensile stress-strain curves: CG Cu, GNG/CG, and free-standing GNG foil[19]. (C) Average transversal grain size vs. tensile true strain: top layer (0-20 μm) and subsurface (20-40 μm) from EBSD. (D-F) TEM images of GNG Cu top surface: 5% (D), 15% (E), 25% (F) tensile strain at room temperature. (G) GNT model of copper. (H) TEM image of GNT, squares indicate local crystal orientation measurement points along solid line for GND density estimation. (I) Loading-unloading tensile curves for GNT samples. (J) Dislocation structures in gradient nanotwins under stress σ, Modes I, II, and III are represented by green, brown, and orange lines, respectively, and the corresponding Burgers vectors are shown on the Thompson tetrahedron. GNDs associated with HNT and GNT are denoted as GNDs_HNT and GNDs_GNT, respectively.


