
fig4
From: Advances in early human embryonic development and organogenesis from spatiotemporal multi-omics
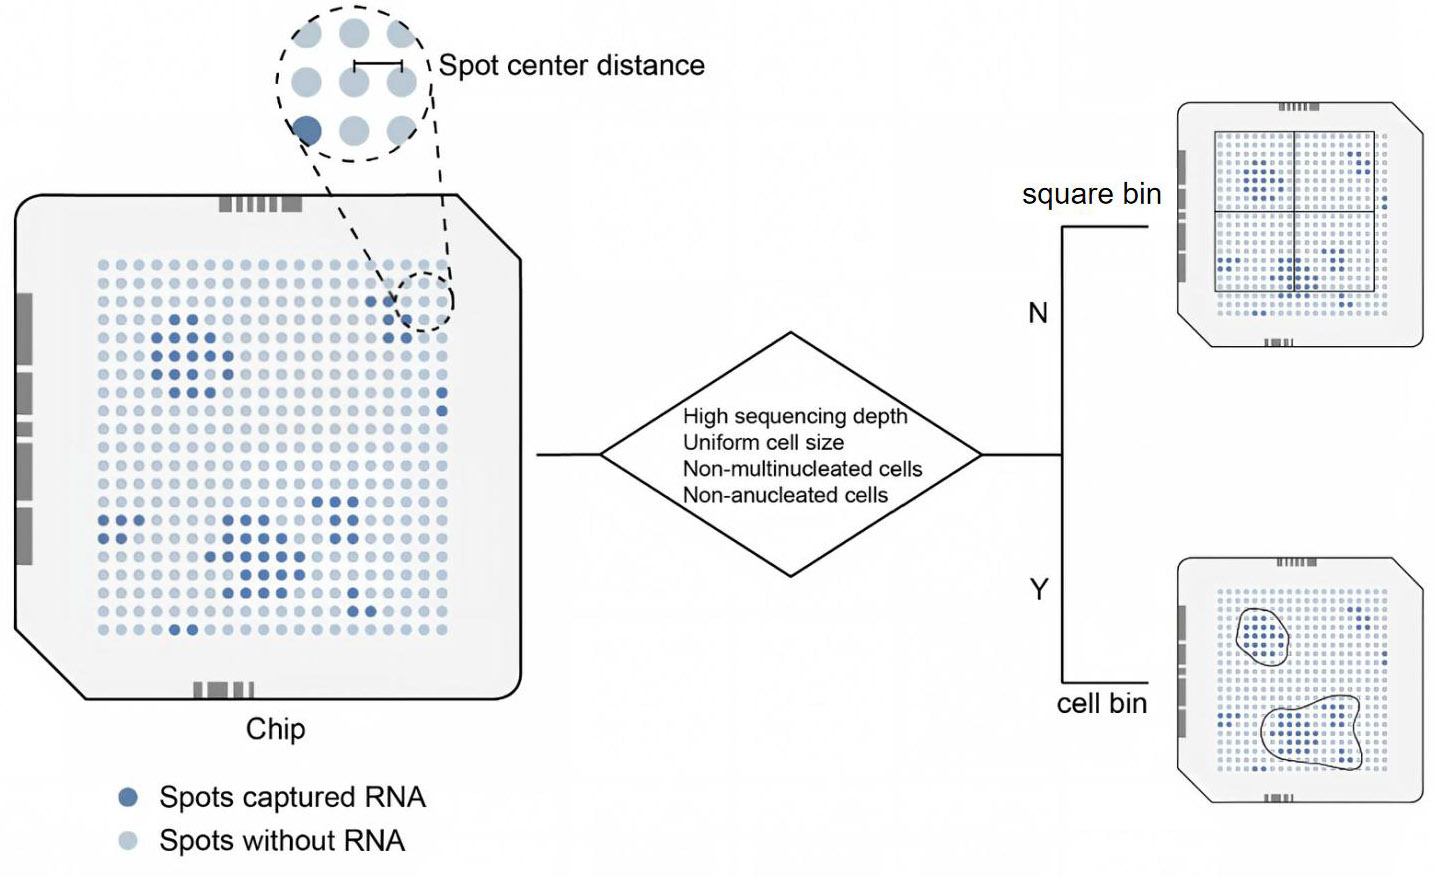
Figure 4. Selection of different analysis unit segmentation strategies based on sample condition and data quality. The square lattice area represents the sequencing chip, and the blue spots indicate the regions where RNA has been captured. The diamond-shaped boxes contain specific criteria for determining the segmentation strategy. The choice between these strategies determines the trade-off between transcriptomic depth and spatial resolution, directly affecting the detection of rare cell populations and fine anatomical structures.