



fig3
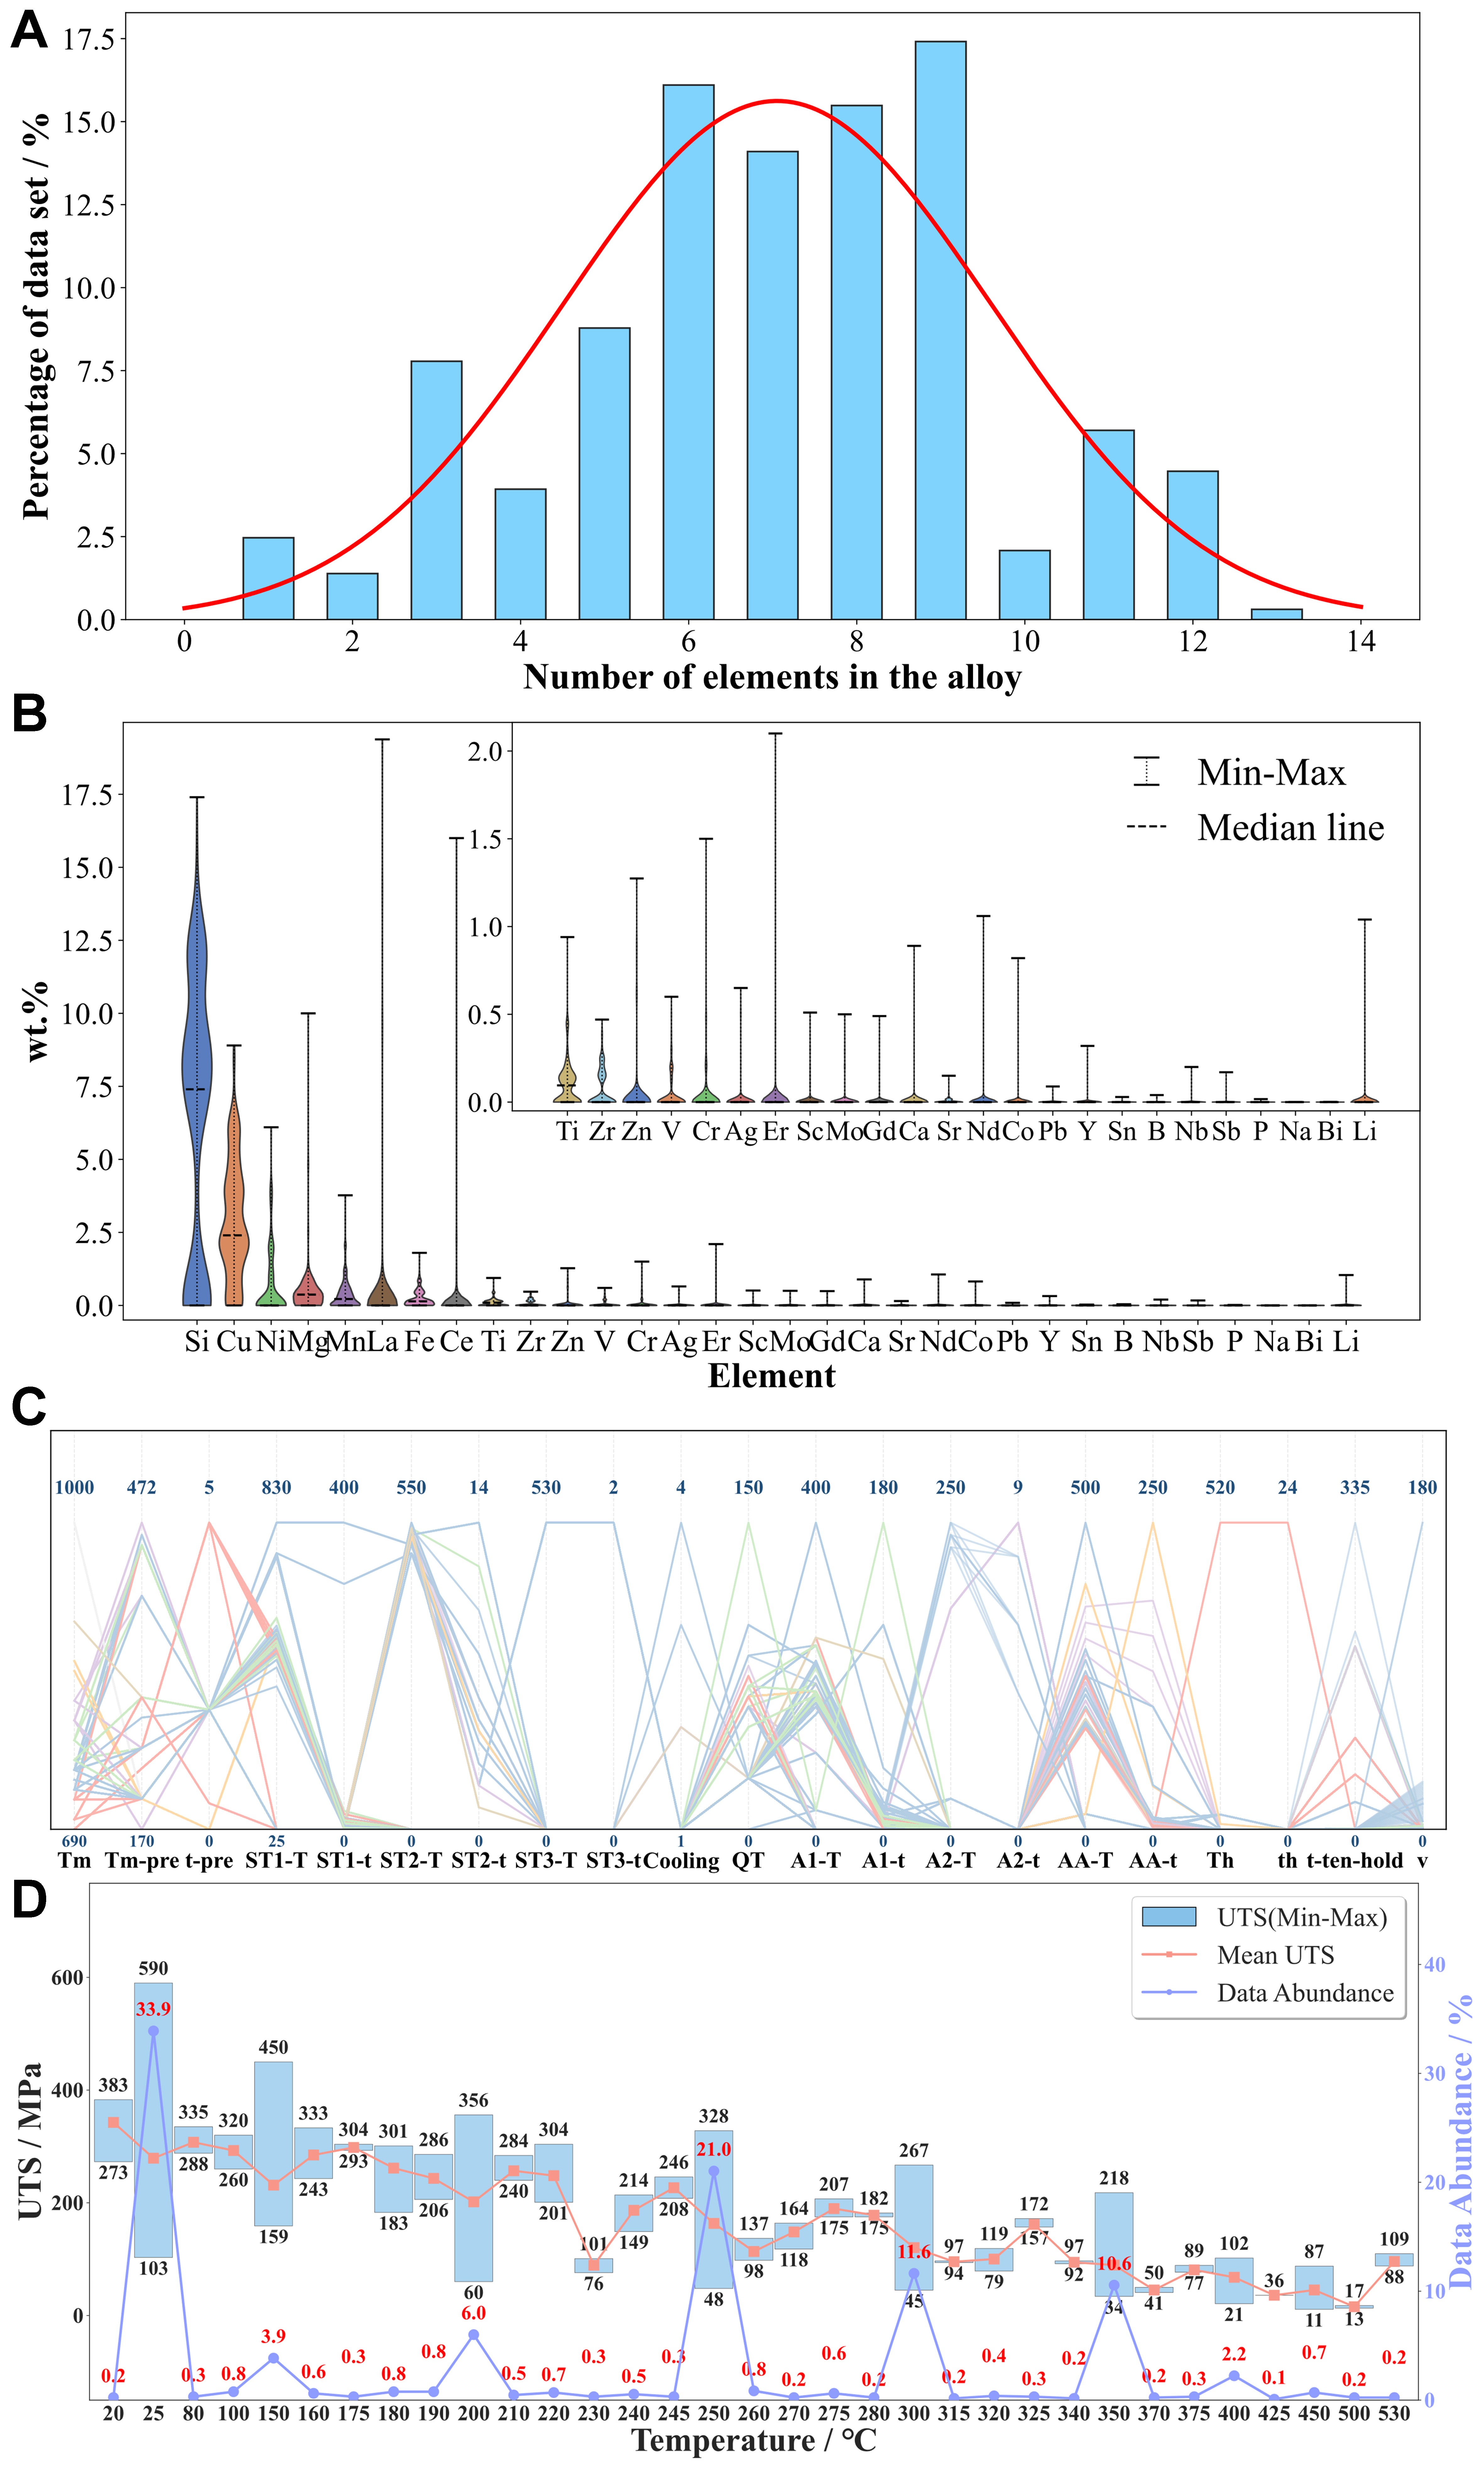
Figure 3. Comprehensive statistical overview of the alloy dataset, covering compositional, processing, and mechanical property spaces. (A) Distribution of the number of constituent elements per alloy system; (B) Statistical distribution of elemental concentrations (wt.%) across the dataset, with an inset highlighting minor alloy addition; (C) Types and value distributions of processing parameters included in the dataset; (D) Temperature-dependent UTS statistics, showing data abundance, mean trends, and min–max variations. UTS: Ultimate tensile strength.