


fig8
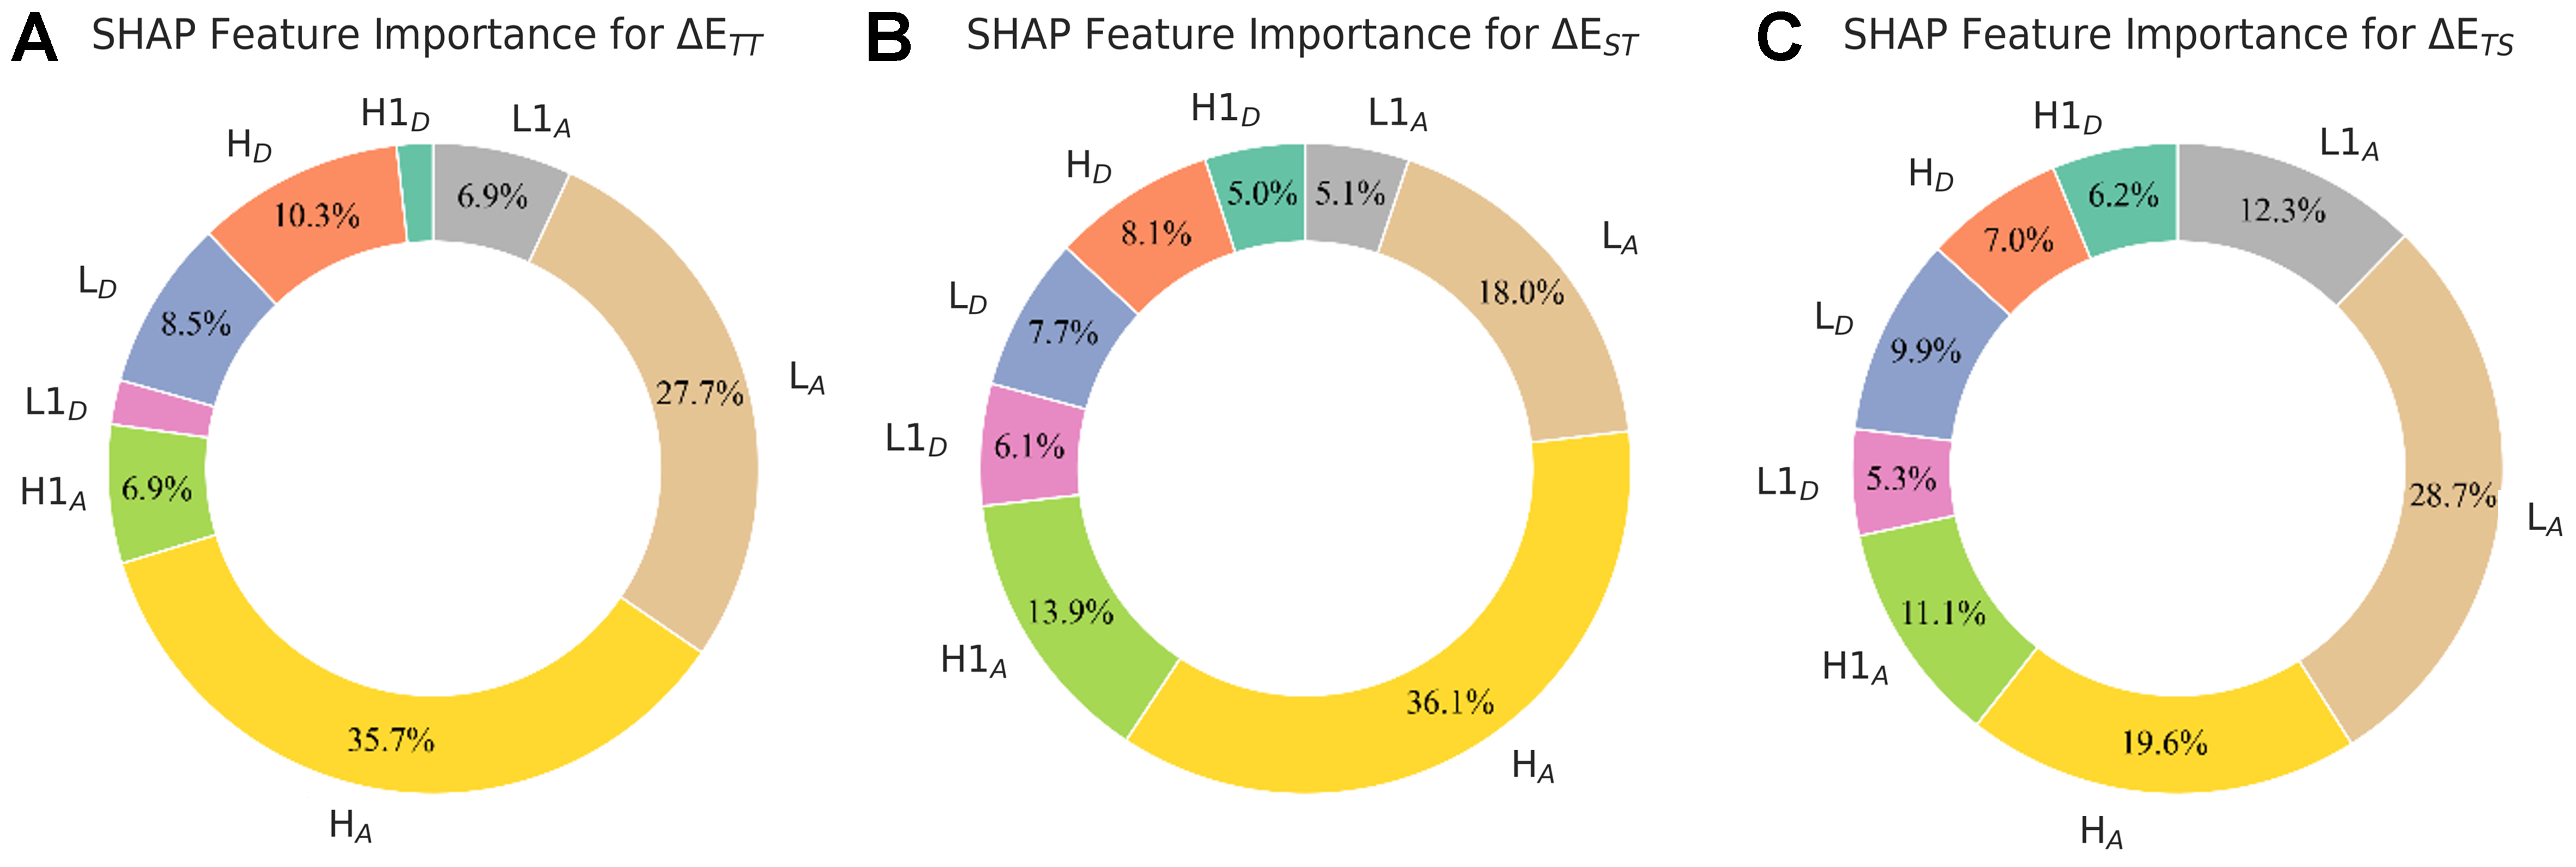
Figure 8. SHAP-derived importance allocations of FODs to energy gap predictions. Circular plots display the percentage distribution of SHAP values for each FOD in XGBoost predictions of (A) ΔETT, (B) ΔEST, and (C) ΔETS. Only features’ contributing > 5% to the prediction are labeled with their percentage values. SHAP: SHapley Additive exPlanations; FODs: fragment orbital descriptors; XGBoost: eXtreme gradient boosting.


