

fig2
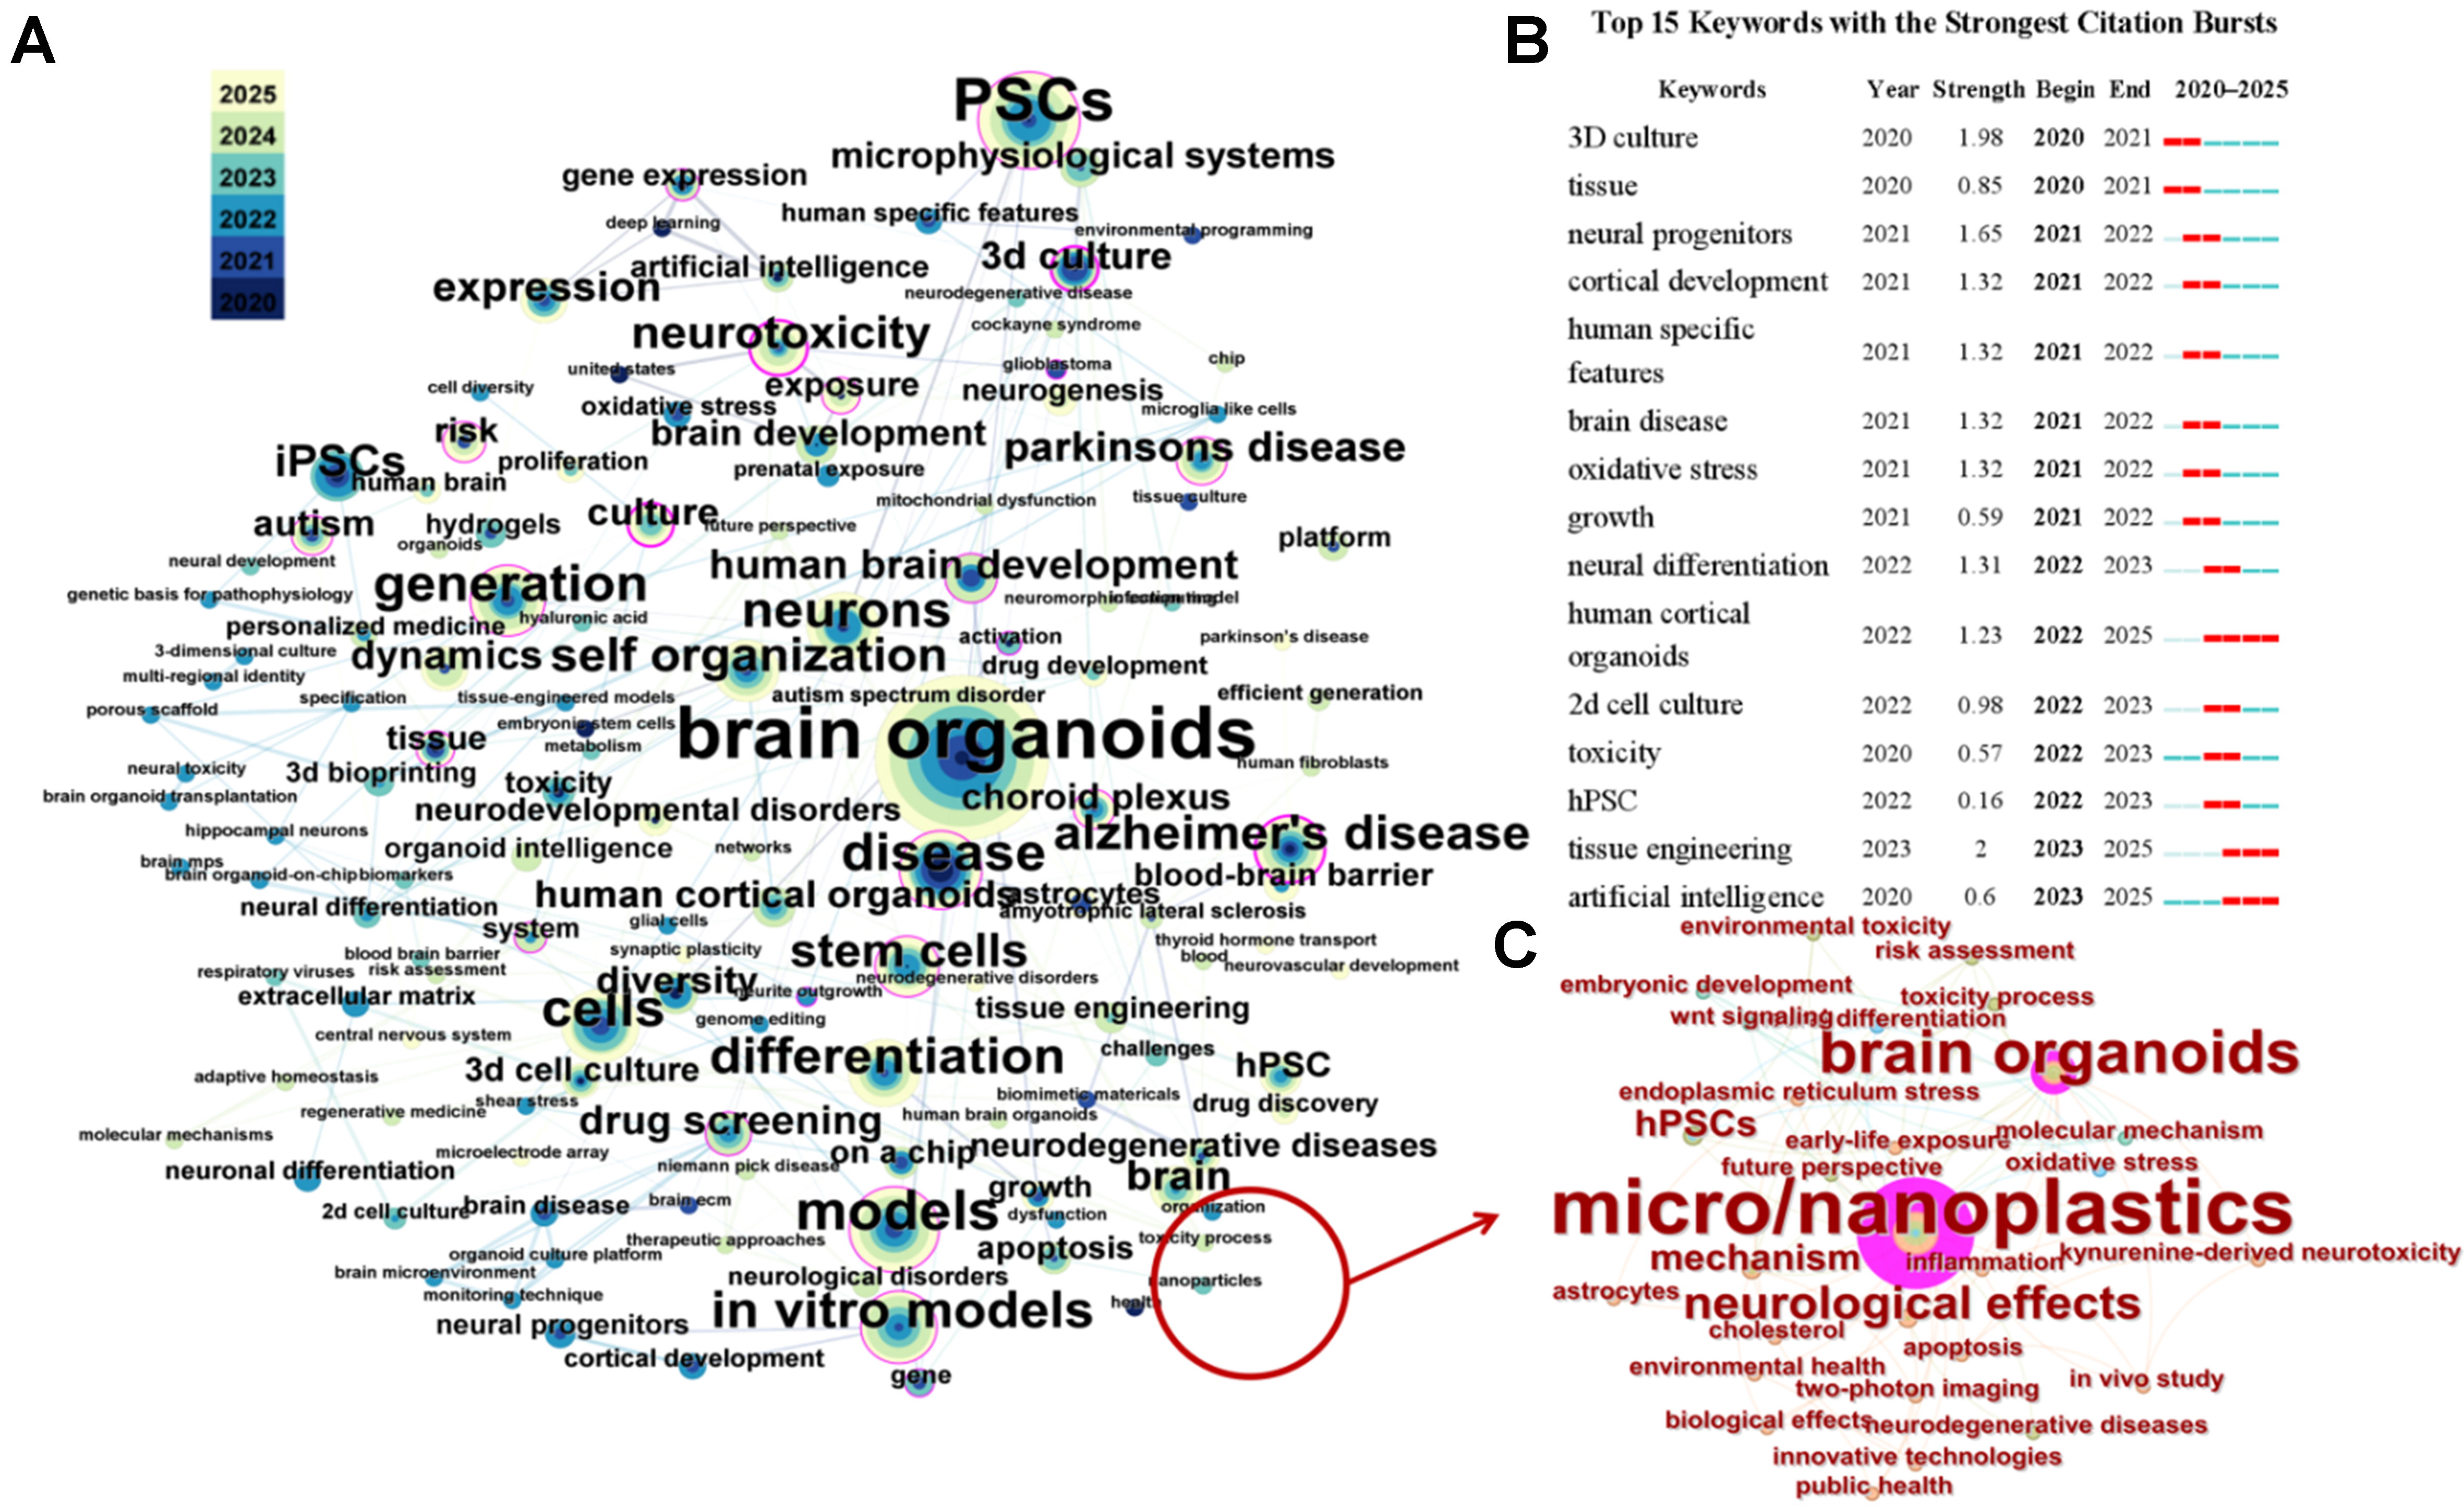
Figure 2. Publications related to brain organoids in the past five years. Keywords co-occurrence network for all environmental pollutants (A) and MNPs (C) extracted from the Web of Science database. Node size represents the frequency of the keywords; color represents their distribution across years; (B) Top 15 keywords emerging. Red indicates the time period of emergence, light blue indicates that the node has not yet appeared, and dark blue indicates that the node has begun to appear. MNPs: Micro/nanoplastics.


