

Behavioral variations and their effects on traffic-related PM2.5 inhalation exposure: findings from three cross-sectional surveys (2015-2020)
 0
0 Abstract
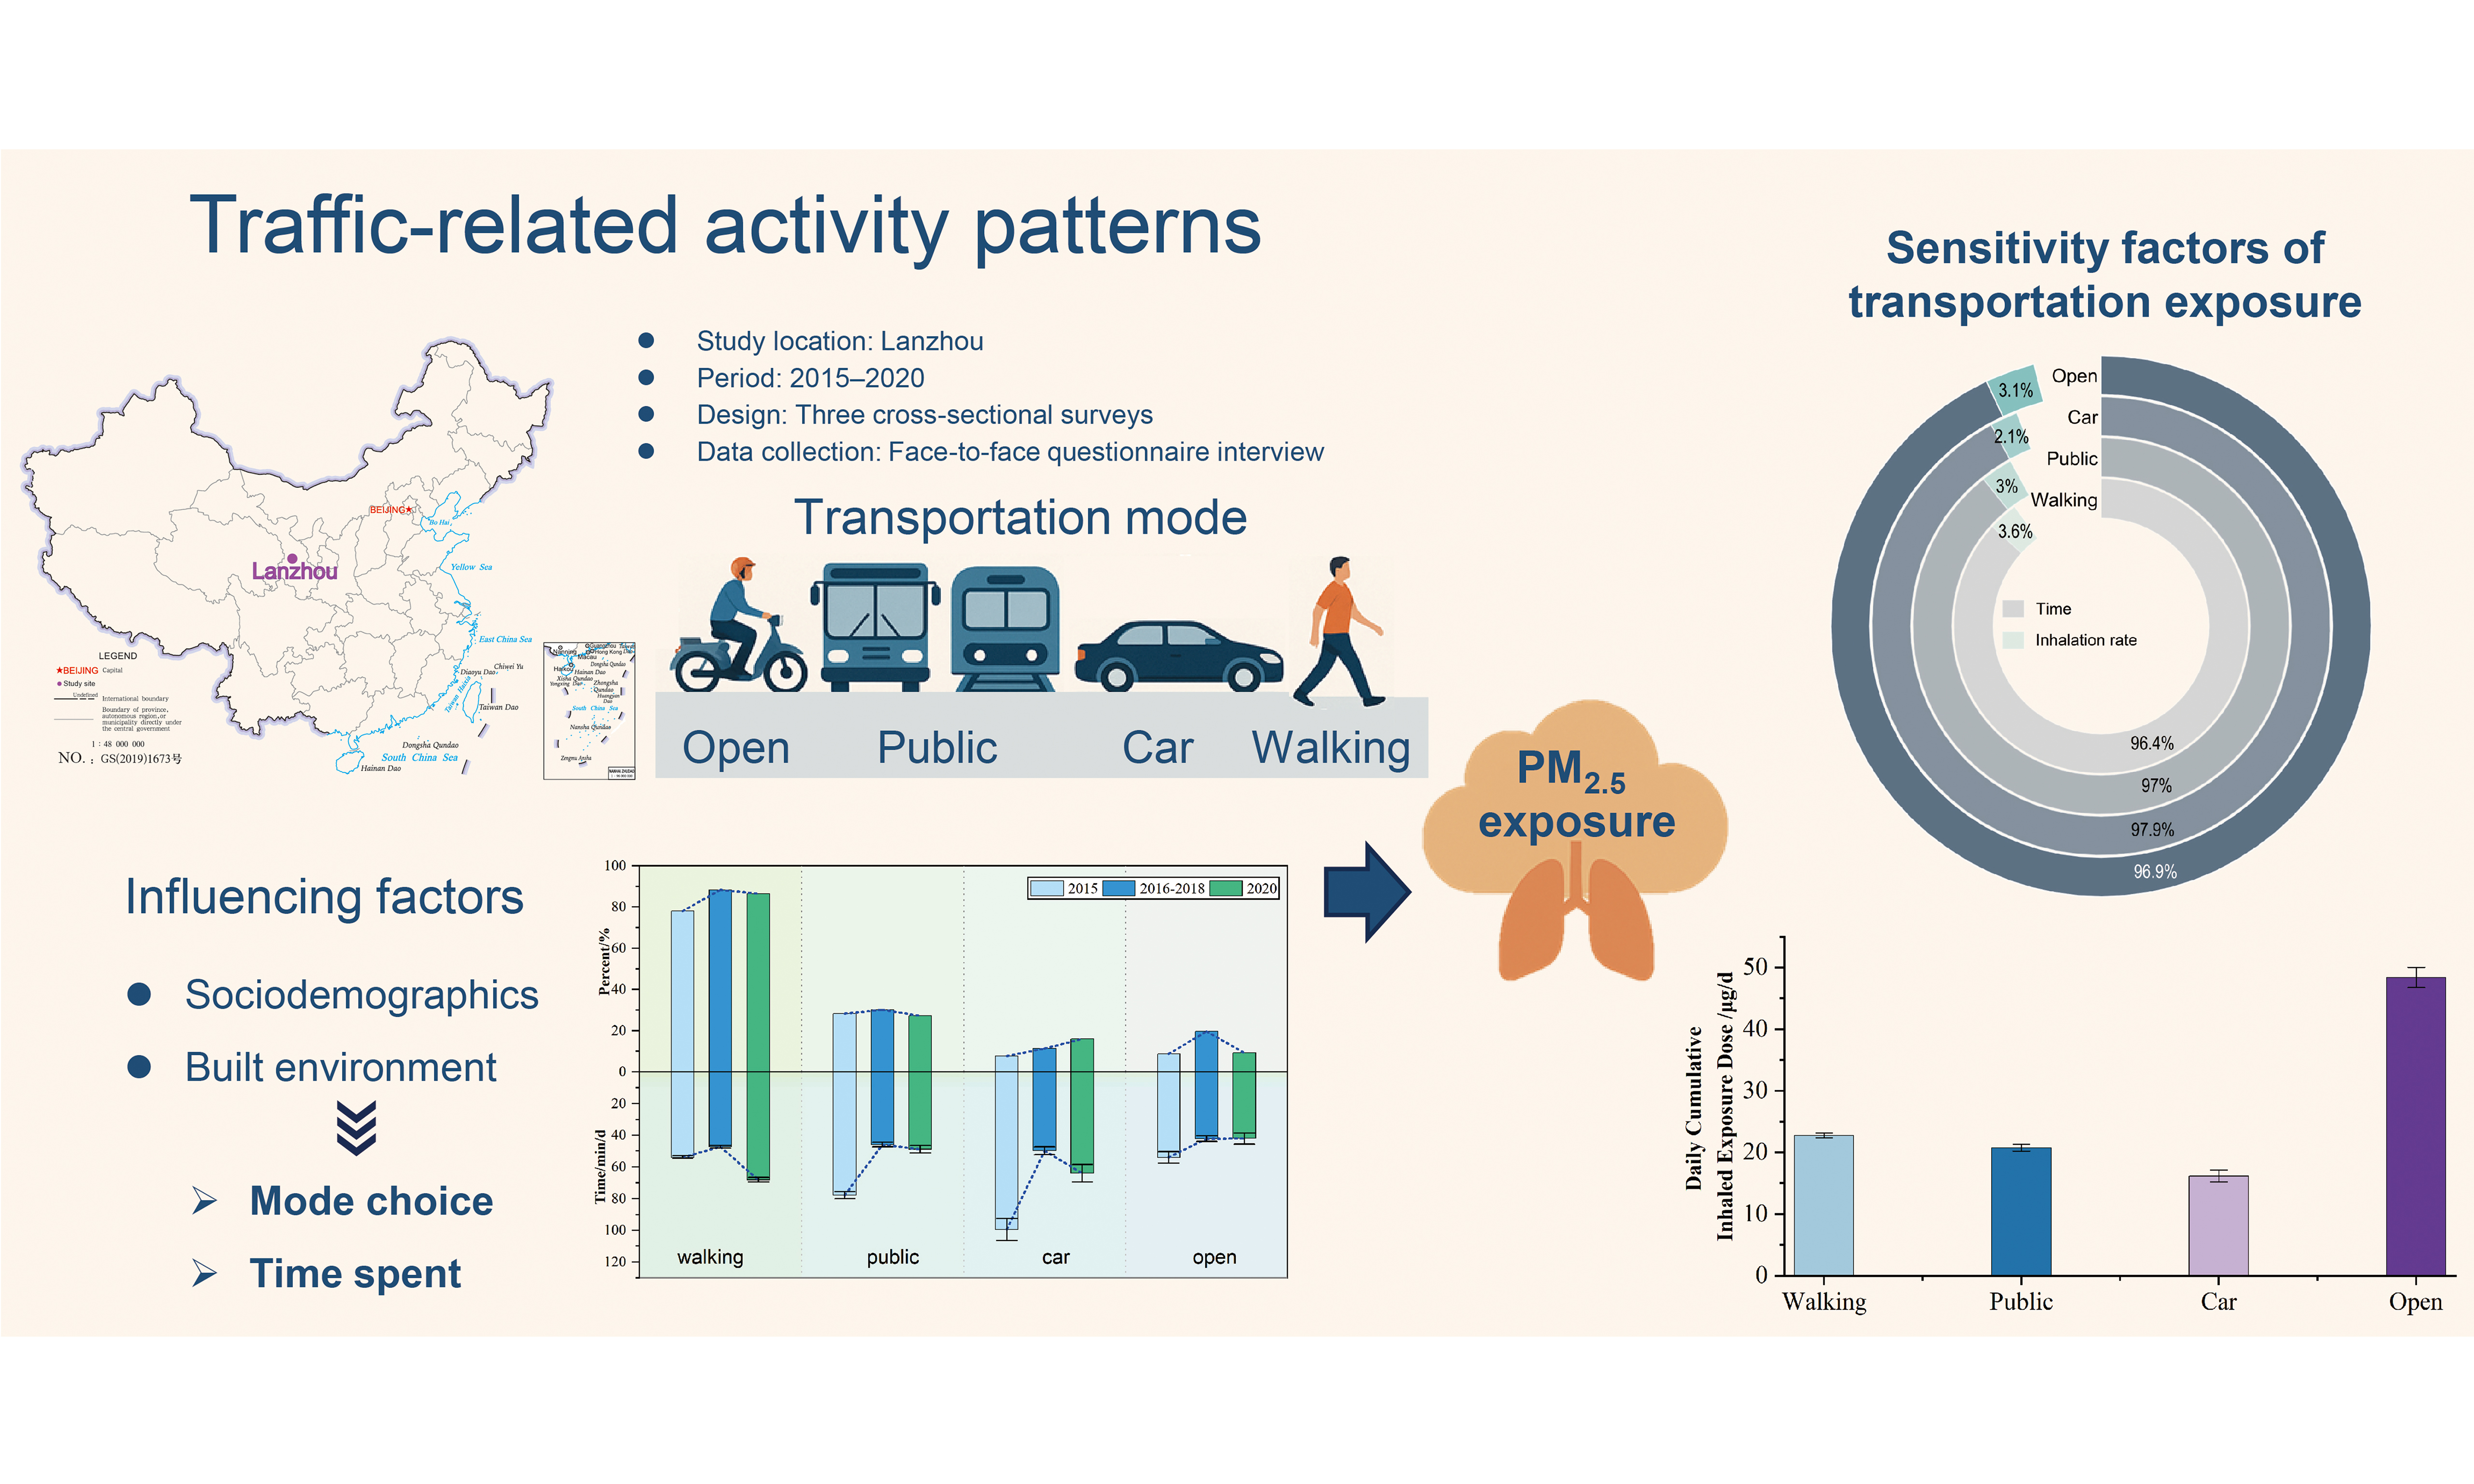
Traffic-related activity patterns, including transportation mode choices and time spent in transit, critically influence individuals’ exposure to air pollution. This study analyzed data from three cross-sectional surveys conducted in Lanzhou, China (2015-2020), to investigate variations in transportation behavior and their impact on daily cumulative PM2.5 inhalation exposure. Results showed that walking was the most frequently used mode, accounting for over 70% of trips, while car use involved the longest average travel time - exceeding 60 min per day. However, trends in mode share and usage time were not synchronized, and the use of different transportation modes was interrelated. Sociodemographic factors and built environment features near homes and workplaces were dynamically associated with transportation behaviors. Time spent in transit had the strongest influence on cumulative daily exposure, explaining more than 90% of the variation across modes. Open modes of transport were linked to the highest exposure levels due to elevated pollutant concentrations and increased inhalation rates, whereas car transportation resulted in the lowest exposure despite its longer duration. These findings underscore the need to incorporate transportation behavior into air pollution exposure assessments and suggest that transportation policies and infrastructure planning should align mobility objectives with public health priorities.
Keywords
INTRODUCTION
Air pollution is a major global environmental and public health concern due to population-wide exposure to a variety of toxic agents[1-3]. Approximately 50% of all deaths attributable to air pollution are linked to increased levels of vehicular traffic[4]. Epidemiological studies have demonstrated strong associations between traffic-related air pollution (TRAP) and a range of adverse health outcomes[5], including cardiovascular effects[4,6,7], respiratory diseases[4,6,8,9], negative birth outcomes[10], asthma[4,11], and allergies[12]. In many urban areas, traffic emissions have become the predominant source of air pollution[13-15], contributing over 40% of particulate matter (PM) pollution in countries such as France and the UK[16], as well as in cities like Beijing[17]. Additionally, ultrafine particles (UFPs) and black carbon (BC) from traffic emissions exhibit strong spatial variability and pose unique health risks across diverse traffic-related microenvironments, underscoring the need for multi-mode exposure assessments in transportation contexts[18].
Although individuals spend only a small fraction of their day in transit, transportation accounts for a disproportionately large share of daily air pollution exposure[3,19,20]. For instance, travel-related activities contribute approximately 25% of daily UFP exposure despite only comprising just 3.4% of total daily time[21]. Similarly, around 30% of daily BC exposure occurs during transportation, even though it accounts for only 6% of total time[22]. Therefore, time spent in various transportation microenvironments is a critical factor in assessing TRAP exposure. Time-activity patterns are vital for estimating population-level exposure[23], as they are closely tied to individuals’ transportation mode choices, such as walking, cycling, or using public transit[24].
Transportation behaviors are influenced by sociodemographic and environmental factors[25]. Variables such as gender, age, education, region type (RT), and household income are all associated with transportation mode preferences and duration[26-29]. For example, walking is more common among females, while males are more likely to cycle[30]. Older adults tend to avoid open modes of transport due to the physical demands involved[31]. Overall, age, gender, and income significantly influence mode choice[32-34]. Thus, a comprehensive understanding of environmental pollutant exposure requires an in-depth assessment of individuals’ transportation behaviors.
Both the mode of transportation and the time spent in transit considerably influence an individual’s exposure to traffic-related pollutants[5,35,36]. For example, although walking is generally associated with lower exposure levels compared to cycling[37], pollutant concentrations can vary substantially across different modes and settings[38]. PM2.5 concentrations are typically lower in cars than in open or public transportation modes in cities like Santiago[39], Taiwan[40], and Milan[20], but tend to be higher in places such as London[41] and Foshan[42]. These variations highlight the importance of considering transportation behaviors, time spent, and microenvironmental concentrations when evaluating TRAP exposure.
Accordingly, the objectives of this study are: (i) analyzing trends in transportation mode choices and time spent based on three cross-sectional surveys conducted in Lanzhou, China; (ii) exploring the associations between sociodemographic and built environment factors and traffic-related behaviors; and (iii) quantifying daily cumulative PM2.5 inhalation exposure across different transportation modes and identifying key exposure determinants. The findings are expected to inform data-driven transportation planning and support personalized behavioral guidance to reduce traffic-related exposure risks.
EXPERIMENTAL
Study design and data collection
This study utilized data from the Total Human Environmental Exposure Pilot Study conducted in Lanzhou, China, from 2015 to 2020. Lanzhou, an inland city, was designated as a National Public Transportation Construction Demonstration City in 2014. Three cross-sectional surveys were carried out in 2015, 2016-2018, and 2020, covering both urban and rural areas. A structured questionnaire, developed by the Chinese Research Academy of Environmental Sciences, was used to collect data on participants’ basic demographic information and time-activity patterns related to exposure behaviors. Participants were selected using random sampling within predefined survey sites. All participants were local residents aged 18 years or older without major medical conditions. Ethical approval was obtained for all surveys, and informed consent was obtained from all participants prior to face-to-face interviews conducted by trained investigators.
The questionnaire collected information on residential address, gender, age, occupation, financial income and expenditure, proximity of main roads to home or workplace, modes of transportation used, and time spent using each mode. Transportation modes were classified as walking, public transportation (bus and subway), car transportation (private cars and taxis), and open transportation (bicycles, electric bicycles, and motorcycles). Sociodemographic variables were grouped as follows: RT, gender (GD), age group (AC), occupation (OP), family annual income (FI), family annual expenditure (FE), and proximity to main roads near residence or workplaces (WT). A total of 4802 valid responses were collected: 2,157 in 2015, 1,323 in 2016-2018, and 1,322 in 2020 [Supplementary Table 1]. RTs were assigned as urban and rural based on the residential addresses. ACs were grouped as 18-29, 30-44, 45-59, and 60 years or older, reflecting different life stages and travel behavior patterns (e.g., young adults, individuals with stable careers, middle-aged adults, and seniors), while ensuring adequate sample sizes for statistical analysis. OPs were categorized into seven types following the Occupational Classification System in China (2015). FI and FE were classified into three levels based on household financial status. Additional sociodemographic details are presented in Supplementary Table 1.
Data cleaning and analysis
Data cleaning and analysis were performed using SPSS 24.0 (IBM, New York, USA) and R (version X64 3.5.1). Descriptive statistics summarized participant characteristics. Sociodemographic variables were reported as sample counts and percentages, transportation mode usage was expressed as percentages, and time spent in each transportation mode was presented as mean values. Chi-square tests were used to compare proportions across sociodemographic categories[27,43]. Multinomial logistic regression analysis was performed to evaluate associations between sociodemographic characteristics and transportation mode preferences[27,43]. Due to distribution characteristics, a rank sum test was employed to examine differences in influencing factors[27]. Redundancy analysis (RDA) using Canoco5.0 (Microcomputer Power, Ithaca, USA) and regression analysis were applied to explore relationships between participant characteristics and time spent using each transportation mode[44,45]. A P-value less than 0.05 was considered statistically significant.
Daily cumulative inhalation exposure analysis
This study evaluated PM2.5-related exposure by calculating the daily cumulative inhalation exposure dose associated with different transportation modes, as defined in Equation (1)[46].
where DEi denotes the daily cumulative inhalation exposure dose (μg/day), Ci is the PM2.5 concentration in the microenvironment for each transportation mode (μg/m3), ETi is the daily time spent in each transportation microenvironment (min/d), and IRi is the inhalation rate for each transportation mode
Daily time spent on different modes of transportation*
| Characteristics | Walking (min/d) | Public (min/d) | Car (min/d) | Open (min/d) | ||||
| Mean (SD) | P-value | Mean (SD) | P-value | Mean (SD) | P-value | Mean (SD) | P-value | |
| Total | 56.0 (38.5) | 60.9 (48.2) | 71.2 (75.9) | 46.0 (39.3) | ||||
| Region type | 0.0004 | 0.003 | 0.317 | 0.670 | ||||
| Urban | 58.2 (40.3) | 61.5 (46.9) | 68.3 (67.8) | 50.7 (46.1) | ||||
| Rural | 53.2 (35.9) | 56.4 (56.2) | 78.4 (93.1) | 43.6 (35.1) | ||||
| Gender | 0.890 | 0.093 | 0.053 | 0.480 | ||||
| Male | 56.2 (39.8) | 63.4 (50.4) | 80.1 (89.7) | 47.6 (41.3) | ||||
| Female | 55.8 (37.2) | 58.6 (45.9) | 58.4 (47.5) | 43.8 (36.4) | ||||
| Age group (years) | < 0.0001 | < 0.0001 | 0.0004 | 0.127 | ||||
| 18-29 | 50.3 (37.6) | 61.1 (48.9) | 73.9 (90.7) | 39.6 (34.4) | ||||
| 30-44 | 56.0 (40.0) | 68.0 (51.8) | 78.9 (78.8) | 47.1 (35.8) | ||||
| 45-59 | 56.1 (39.2) | 63.7 (48.5) | 64.8 (63.0) | 48.1 (43.5) | ||||
| ≥ 60 | 58.9 (36.3) | 44.7 (35.7) | 40.9 (33.3) | 43.0 (35.8) | ||||
| Occupation | 0.0001 | < 0.0001 | 0.004 | 0.418 | ||||
| Scientific and technical personnel | 55.6 (40.7) | 53.3 (35.2) | 49.3 (29.0) | 50.6 (54.6) | ||||
| Social and economic personnel | 55.5 (38.1) | 65.4 (37.3) | 47.2 (32.7) | 39.3 (25.5) | ||||
| Officers and related personnel | 57.3 (41.9) | 67.0 (43.3) | 68.5 (58.1) | 48.0 (35.0) | ||||
| Business and services personnel | 52.6 (40.9) | 47.6 (55.4) | 103.0 (126.2) | 39.9 (25.1) | ||||
| Agricultural personnel | 54.7 (36.2) | 46.4 (51.3) | 69.0 (84.1) | 41.6 (30.7) | ||||
| Manufacturing personnel | 61.9 (35.3) | 84.0 (50.9) | 94.4 (85.3) | 61.0 (58.0) | ||||
| Inconvenient-to-classify personnel | 56.8 (39.6) | 58.4 (46.7) | 58.2 (50.0) | 53.3 (49.7) | ||||
| Family annual income (CNY) | 0.298 | < 0.0001 | 0.030 | 0.288 | ||||
| < 30,000 | 54.7 (35.2) | 59.6 (49.6) | 80.2 (76.1) | 45.3 (40.3) | ||||
| < 100,000 | 55.9 (38.7) | 51.0 (42.1) | 65.8 (87.9) | 42.2 (32.8) | ||||
| ≥ 100,000 | 58.2 (43.0) | 70.6 (50.0) | 69.8 (67.6) | 51.3 (44.3) | ||||
| Family annual expenditure (CNY) | 0.164 | < 0.0001 | 0.228 | 0.022 | ||||
| < 30,000 | 54.6 (35.1) | 60.7 (49.2) | 77.1 (81.8) | 48.7 (42.3) | ||||
| < 100,000 | 59.3 (44.1) | 55.4 (46.3) | 66.9 (83.3) | 39.4 (33.5) | ||||
| ≥ 100,000 | 57.1 (43.7) | 71.1 (46.1) | 65.9 (50.9) | 46.6 (33.6) | ||||
The annual average ambient PM2.5 concentration in Lanzhou during the study period (47.20 μg/m3), as reported in the Report on the State of the Environment in Lanzhou[49], was used as the baseline for walking. Relative concentration ratios, derived from the literature [Supplementary Table 2][20,39-42,46,48,50,51], were applied to estimate PM2.5 levels for other modes: 1.30 for walking/car, 1.02 for public/walking, and 1.04 for open/walking. Consequently, the calculated PM2.5 exposure concentrations were 48.14 μg/m3 for public transportation, 36.31 μg/m3 for car transportation, and 49.10 μg/m3 for open transportation. Details of the relative concentration ratios are provided in the Supplementary Materials. Finally, a sensitivity analysis of the daily cumulative inhalation exposure dose was conducted using Monte Carlo simulation (Crystal Ball software, Oracle Corporation, Austin, USA), with 10,000 iterations to assess the relative influence of each input parameter.
RESULTS AND DISCUSSION
Characteristics of transportation mode use by time, population, and region
Across the three survey periods (2015, 2016-2018, and 2020), walking remained the most commonly used mode of transportation, with usage rates exceeding 70% in all years and increasing by 8.5% from 2015 to 2020 [Figure 1 and Supplementary Table 3]. Public transportation ranked second, followed by car and open transportation. Although car use was initially less common, its prevalence increased steadily over time and surpassed that of open transportation by 2020. Use of open transportation increased temporarily during 2016-2018 but decreased sharply by 9.2% in 2020 [Supplementary Table 3].
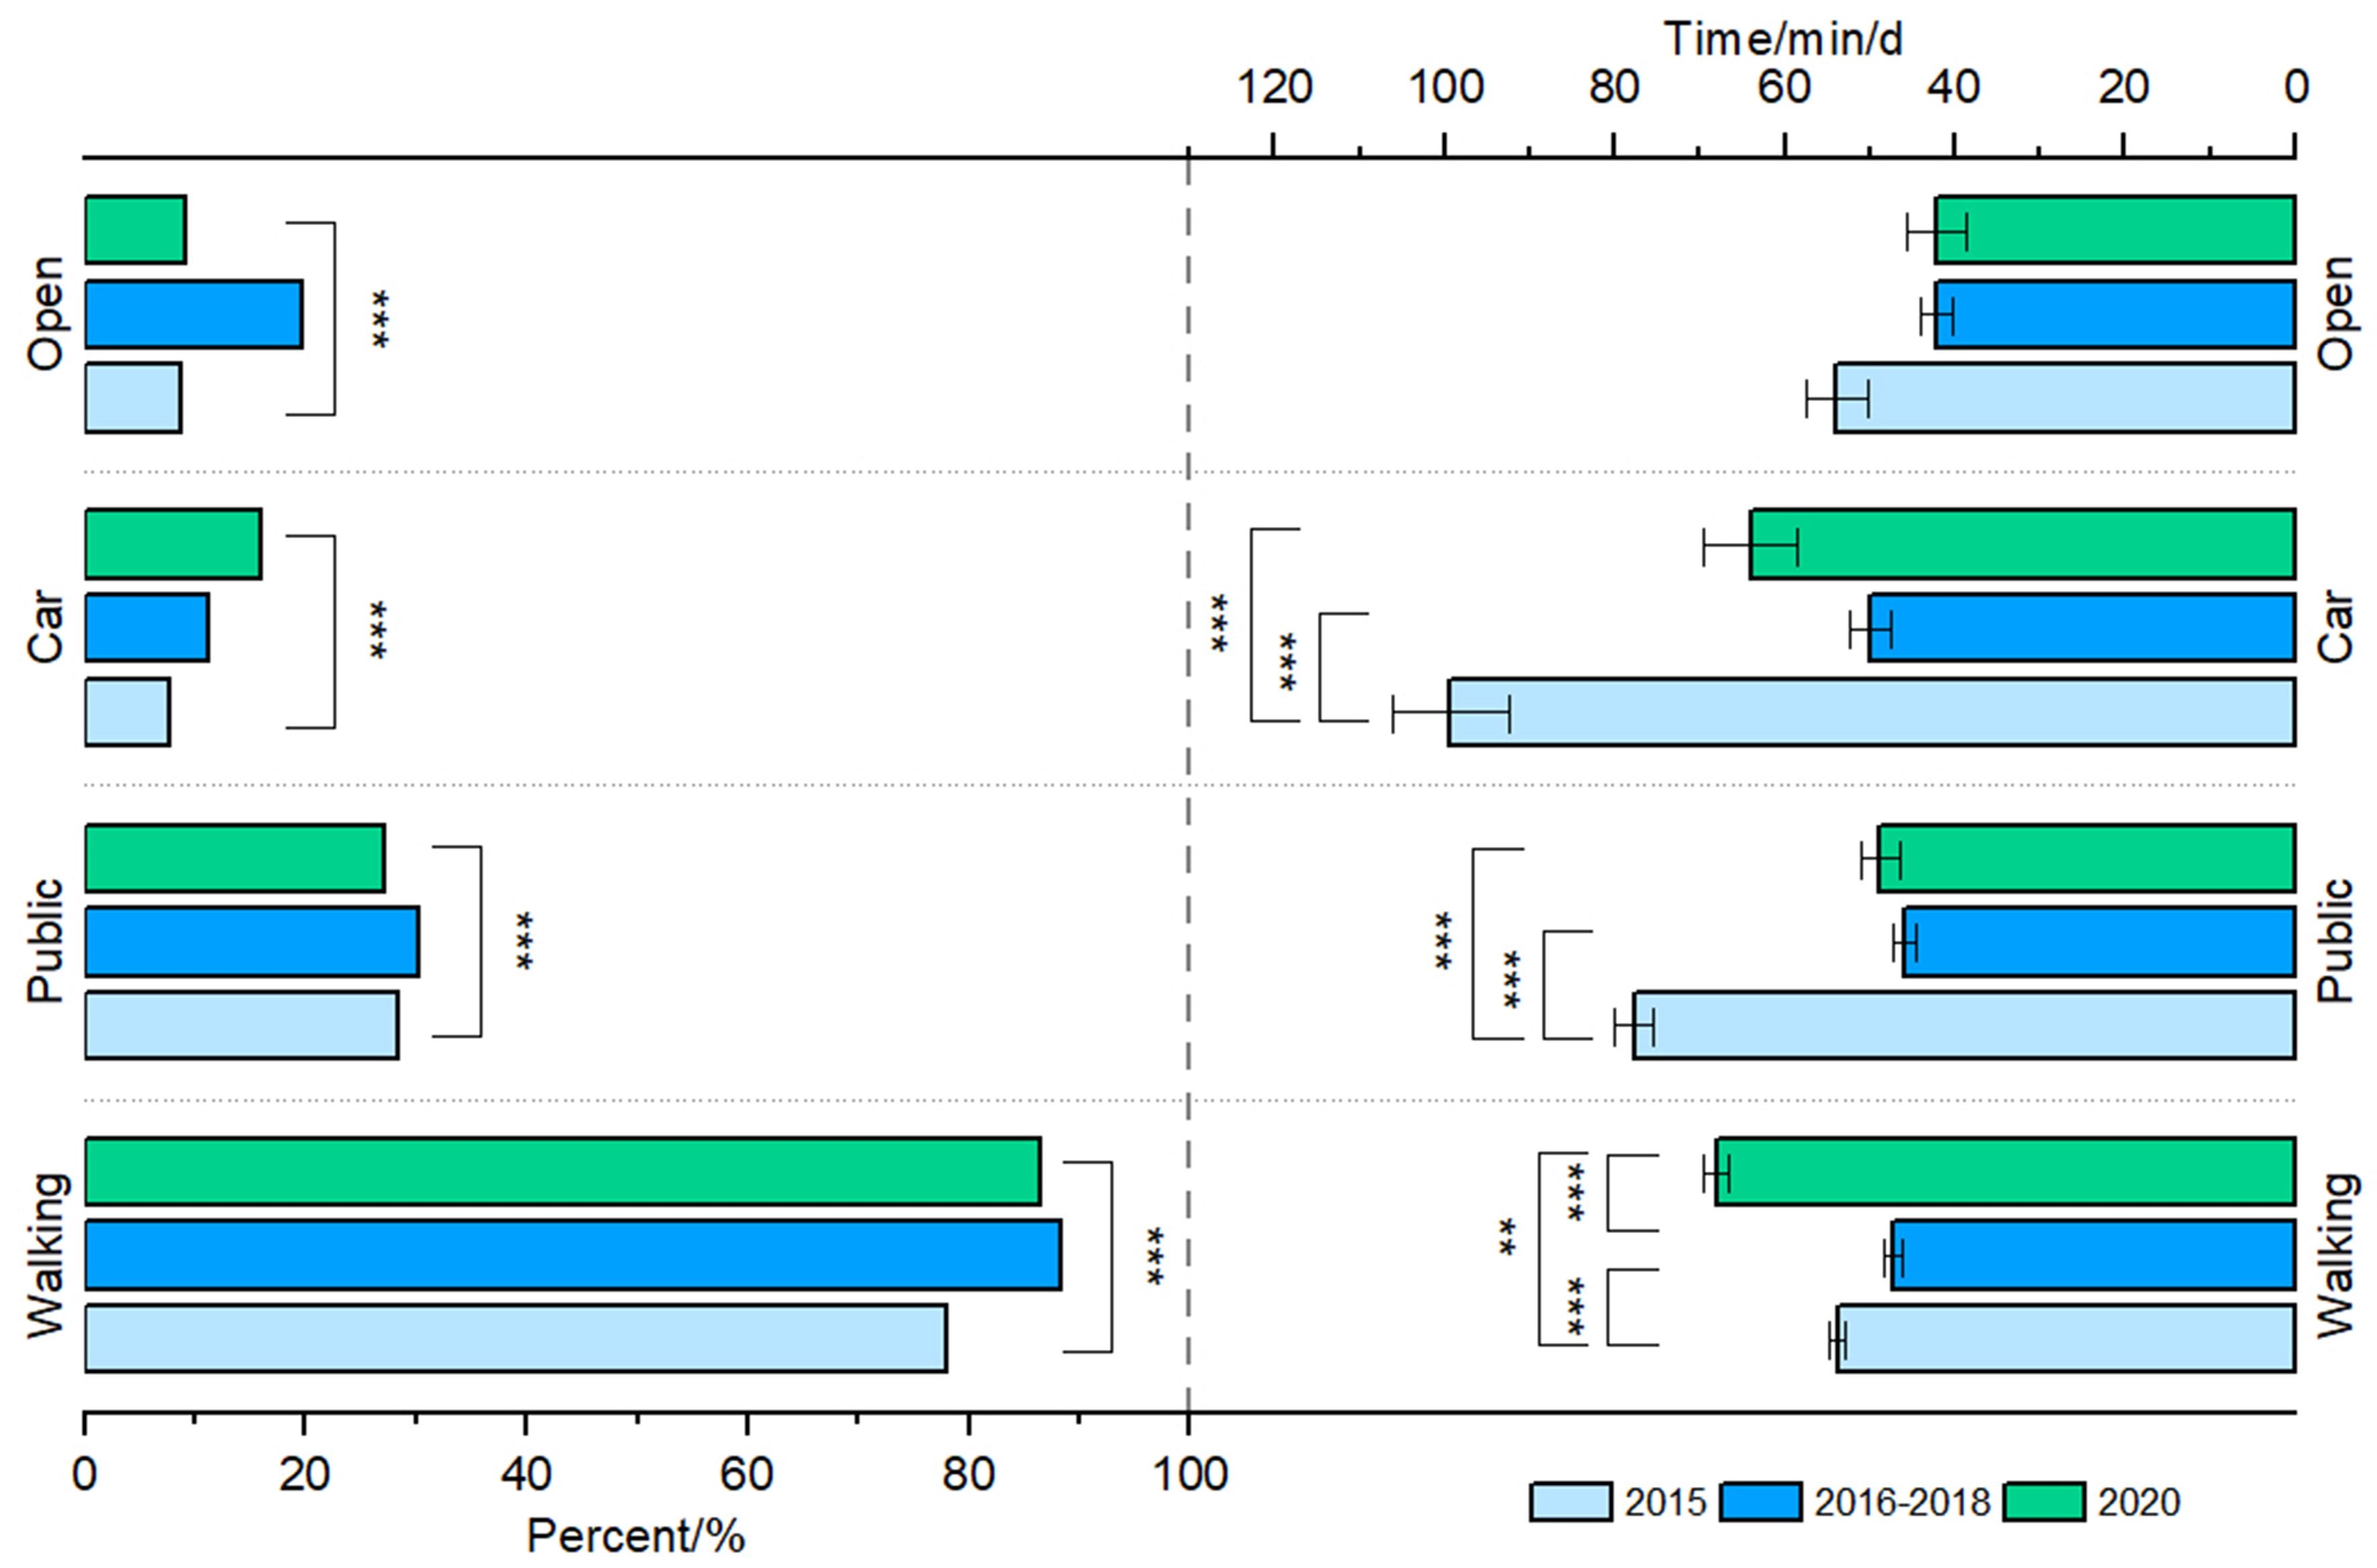
Figure 1. Trends in transportation mode use and time spent by participants across three surveys. **P-value ≤ 0.001, ***P-value < 0.0001.
As shown in Supplementary Figure 1 and Supplementary Table 3, urban residents consistently reported higher rates of walking, public transportation, and car use compared to rural residents, whereas the use of open transportation remained low in both groups. The urban-rural gap in open transportation usage narrowed from 7.3% in 2015 to 3.5% in 2020. Gender differences were evident as well: the proportion of females using public transportation increased by 6.4% from 2015 to 2020, compared to only a marginal increase among males. Conversely, car use rose by 9.4% among males and 7.1% among females. Additionally, differences by age and occupation were observed. In particular, public transportation use declined among individuals aged 18-29 years and 45-59 years across the survey periods, while walking and car use increased in these groups. Open transportation use initially increased and peaked in 2016-2018, then declined across all age groups. Agricultural workers consistently showed a high rate of open transportation use, second only to walking. In addition, car use was more prevalent among individuals with higher family incomes and expenditures, with the proportion rising in parallel with economic level.
As presented in Supplementary Table 4, transportation mode preferences were also influenced by proximity to major roads. People working near main roads were more likely to use public transportation, with an average usage rate 26.27% higher than other groups. Interestingly, their walking rates were also higher.
Figure 2 and Supplementary Tables 5 and 6 illustrate the associations between transportation modes and sociodemographic characteristics. Urban residents consistently preferred public transportation over walking, though this preference declined by 2020. Preference for car use declined relative to walking, while preference for open transportation increased marginally. Gender-wise, males showed greater willingness to use car and open transportation in the 2015 and 2020 surveys. Younger age groups (18-29 and 30-44 years) were consistently more likely to choose car and open transportation. Occupation had limited influence on transportation mode choice, with notable differences observed only for car use among the higher-income groups in 2020.
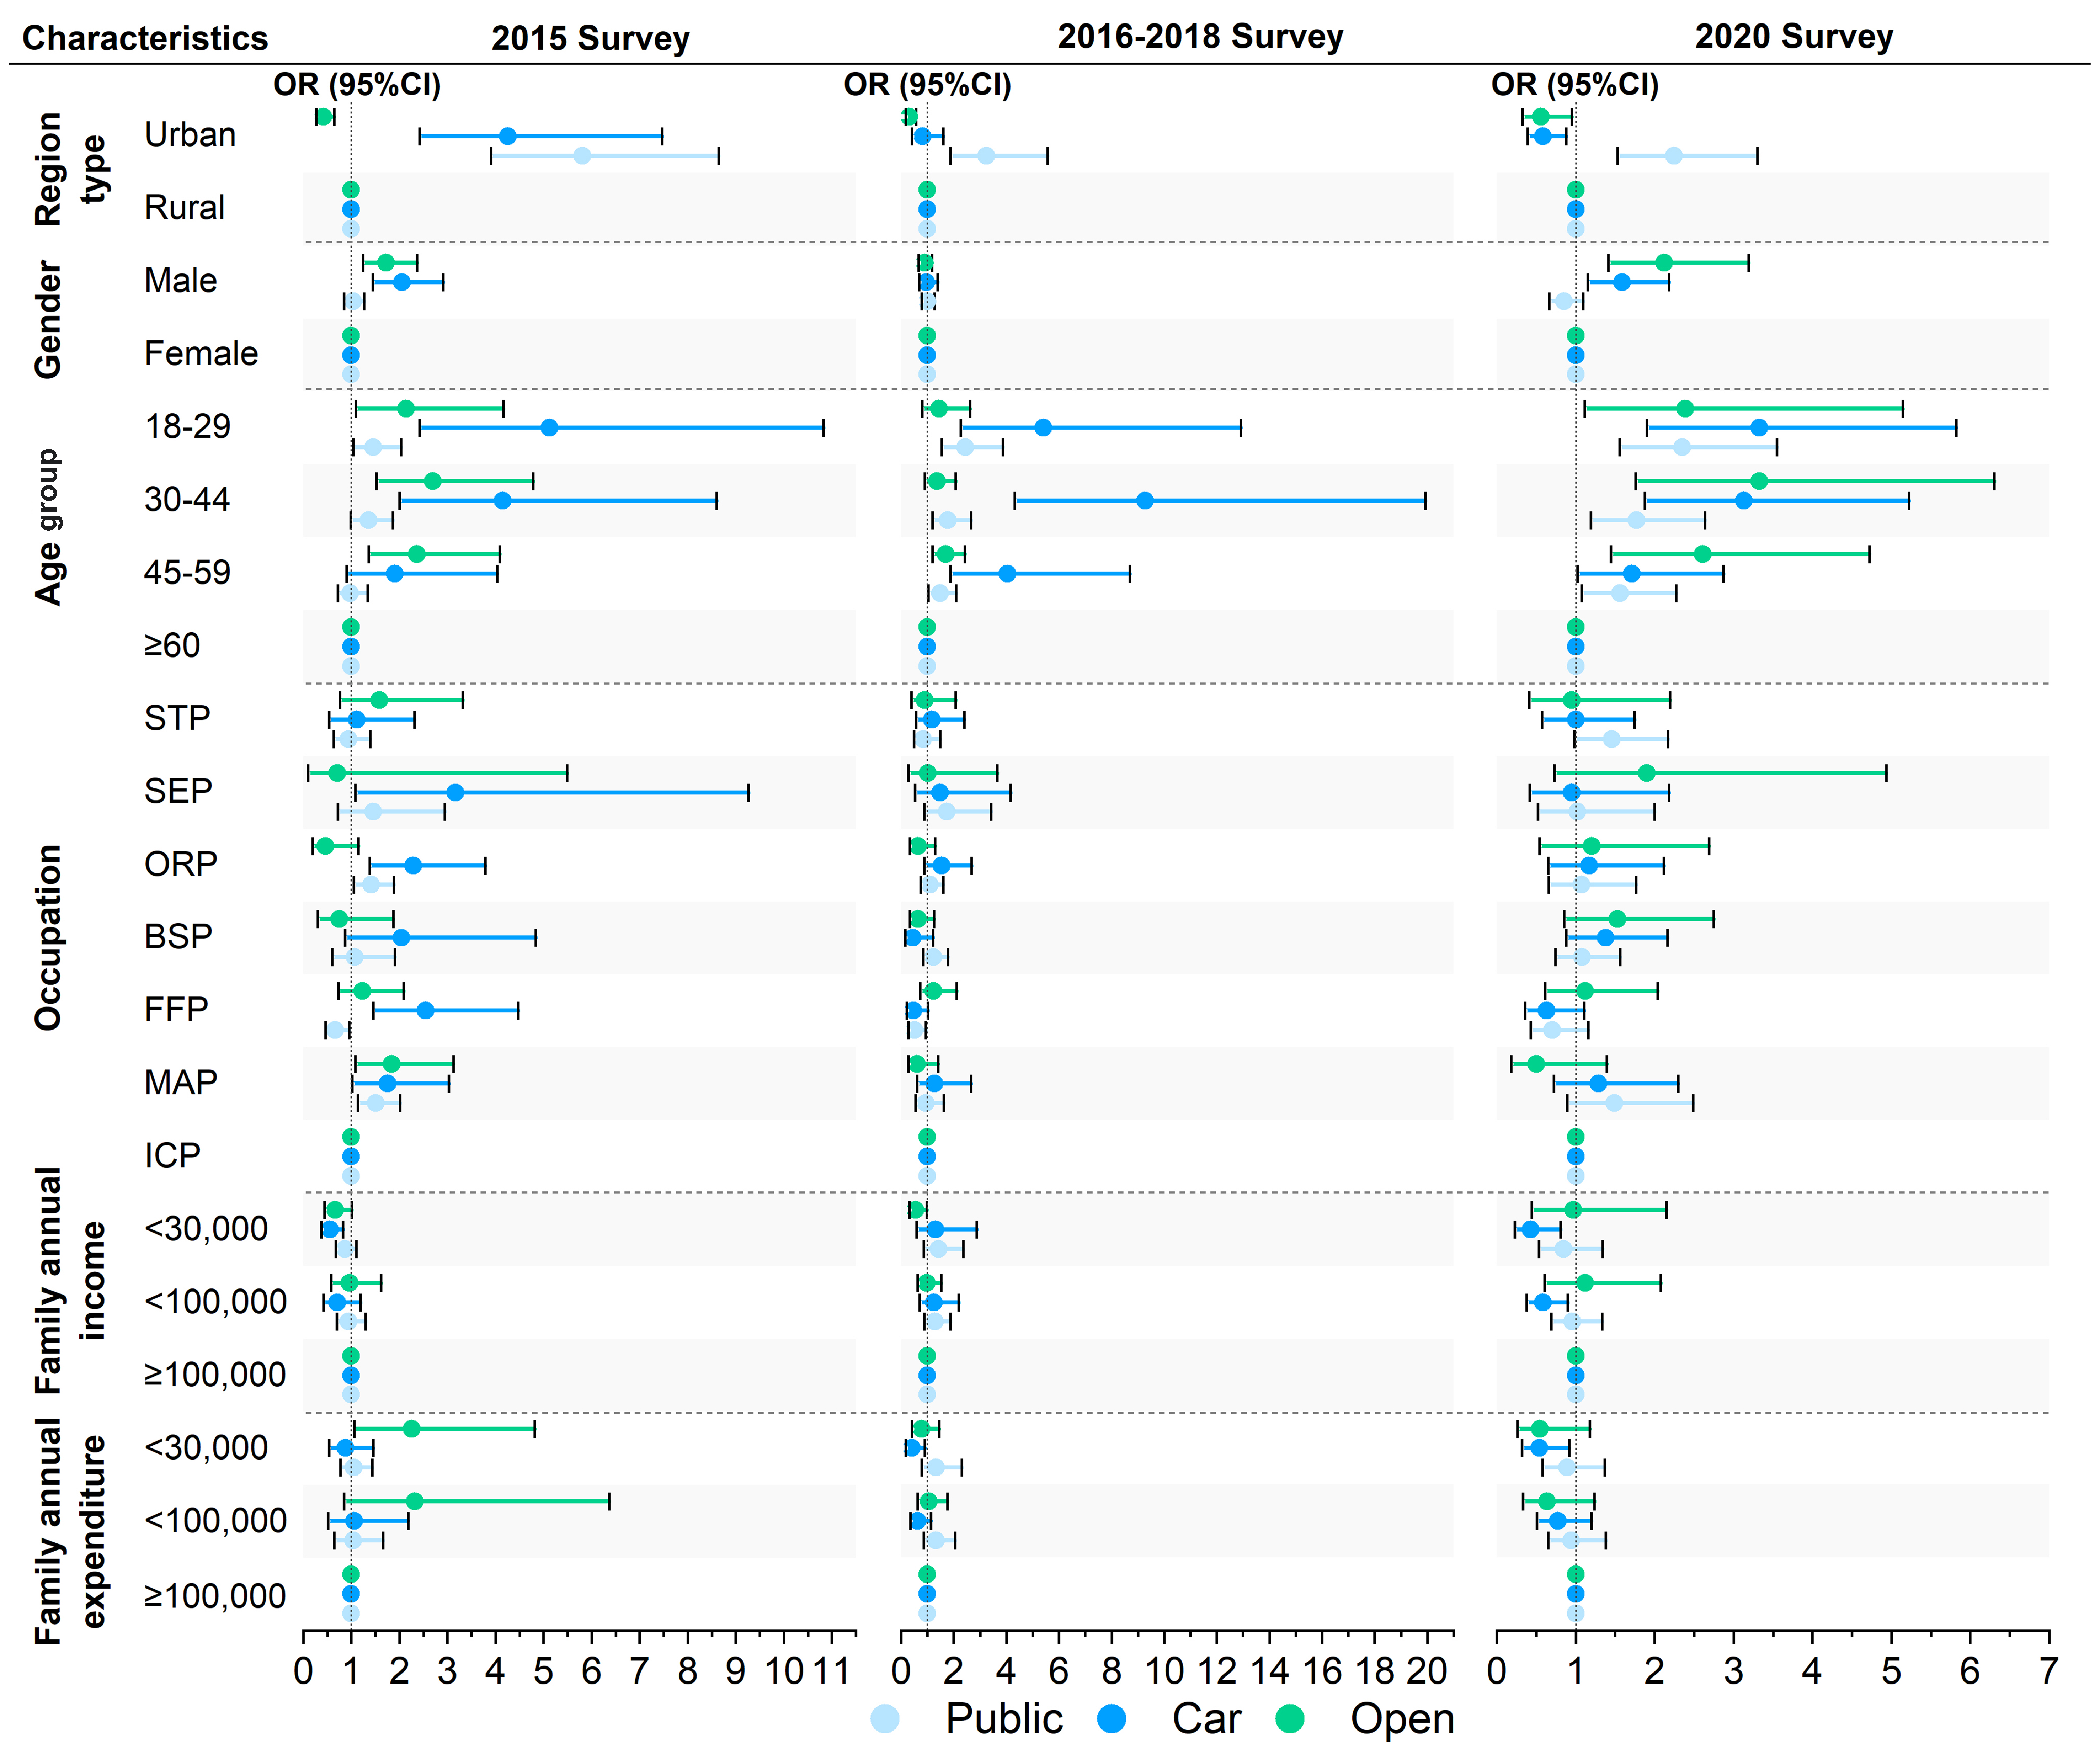
Figure 2. Associations between transportation modes and sociodemographic characteristics. Family annual income and expenditure are expressed in CNY. Walking was used as the reference transportation mode. STP: Scientific and technical personnel; SEP: social and economic personnel; ORP: officers and related personnel; BSP: business and services personnel; FFP: agricultural personnel; MAP: manufacturing personnel; ICP: inconvenient-to-classify personnel.
Time spent on transportation and its determinants
Table 1 presents the average daily time spent using each mode of transportation. Among all modes, car transportation accounted for the longest average duration, typically exceeding 1 h per day, followed by public transportation, walking, and open transportation. Urban residents generally spent more time walking and using public and open transportation, while rural residents spent more time traveling by car. A gender-based analysis showed that males spent more time than females across all transportation modes. For public and car transportation, men spent an average of 4.8 and 21.7 min more per day, respectively, although these differences were not statistically significant.
Walking time increased steadily with age [Table 1]. In contrast, younger individuals tended to spend more time using public and car transportation. For instance, the 18-29 age group spent an average of 16.4 min more per day on public transportation and 33.0 min more per day on car transportation than those aged 60 and above. Notable differences were also observed across occupations: business and service personnel spent over 100 min per day using car transportation. Individuals with a FI or FE of CNY100,000 or more reported the longest transportation durations, except for car use. The built environment also significantly influences transportation time. People living near major roads spent more time using public and car transportation and less time walking. Conversely, those without access to roads near their home or workplace spent less time using public transport and more time walking [Supplementary Table 7].
Trends in time use varied across the surveys [Figure 1]. In the 2016-2018 survey, the time spent across all transportation modes was generally the lowest, and the differences between modes were the smallest. By 2020, walking time had increased compared to 2015, while time spent on public, car, and open transportation had decreased by 37.2%, 35.6%, and 21.9%, respectively [Supplementary Table 8]. The decline in car and open transportation was more evident in urban areas, whereas the reduction in public transportation time was more prominent in rural areas.
RDA [Supplementary Figure 2] revealed that gender, age, RT, FI, and FE were the primary factors influencing transportation time. Car transportation time was positively associated with higher income levels, while walking time was inversely related. The influence of RT varied over time, positively affecting open transportation in 2015 and 2020, but having a negative effect during 2016-2018. The influence of economic factors on public transportation time also shifted across surveys: FI had a greater impact in 2015, while FE became more influential by 2020. Regression analysis [Supplementary Table 9] further confirmed that RT and age group significantly affected time spent on walking and open transportation (P-value < 0.01), while gender and age group were major contributors to car transportation time (P-value < 0.05). A comparison across the three surveys [Supplementary Table 10] indicated that the most influential factors changed over time. For instance, RT was the strongest predictor of walking time in 2015 and 2016-2018, while occupation became more influential in 2020. These temporal shifts reflect broader changes in socioeconomic conditions and infrastructure.
Impact of traffic-related activity patterns on PM2.5 inhalation exposure
As illustrated in Supplementary Figure 3, time spent in each transportation mode was the primary determinant of daily cumulative PM2.5 inhalation exposure, explaining over 96% of the variance across all modes. Although car travel consumed the most time, it resulted in the lowest exposure dose (16.20 μg/day), due to the lower PM2.5 concentrations typically found in cabin environments. In contrast, open transportation modes led to the highest exposure dose (48.42 μg/day), driven by both higher pollutant concentrations and elevated inhalation rates associated with physical exertion [Supplementary Table 11]. These differences reflect the combined effects of travel duration, microenvironmental PM2.5 levels, and inhalation rate on cumulative exposure. Modes involving greater physical intensity and closer proximity to traffic emissions produced higher exposures even over shorter durations, while modes with longer durations but lower pollutant concentrations and physical activity levels resulted in relatively lower cumulative exposure.
Although walking time exceeded that of open transportation [Table 1], the exposure dose from open transportation was 2.11 times higher, due to more intense inhalation and closer proximity to emission sources. In urban areas, longer walking durations led to a 1.37-fold higher exposure compared to rural areas [Supplementary Table 11]. Additionally, subgroup analysis [Figure 3] revealed that exposure patterns were closely aligned with individual time-use distributions. These findings underscore the importance of considering both travel duration and inhalation rate when interpreting mode-specific exposure differences. Briefly, time-activity patterns across transportation modes play an important role in determining daily cumulative PM2.5 inhalation exposure.
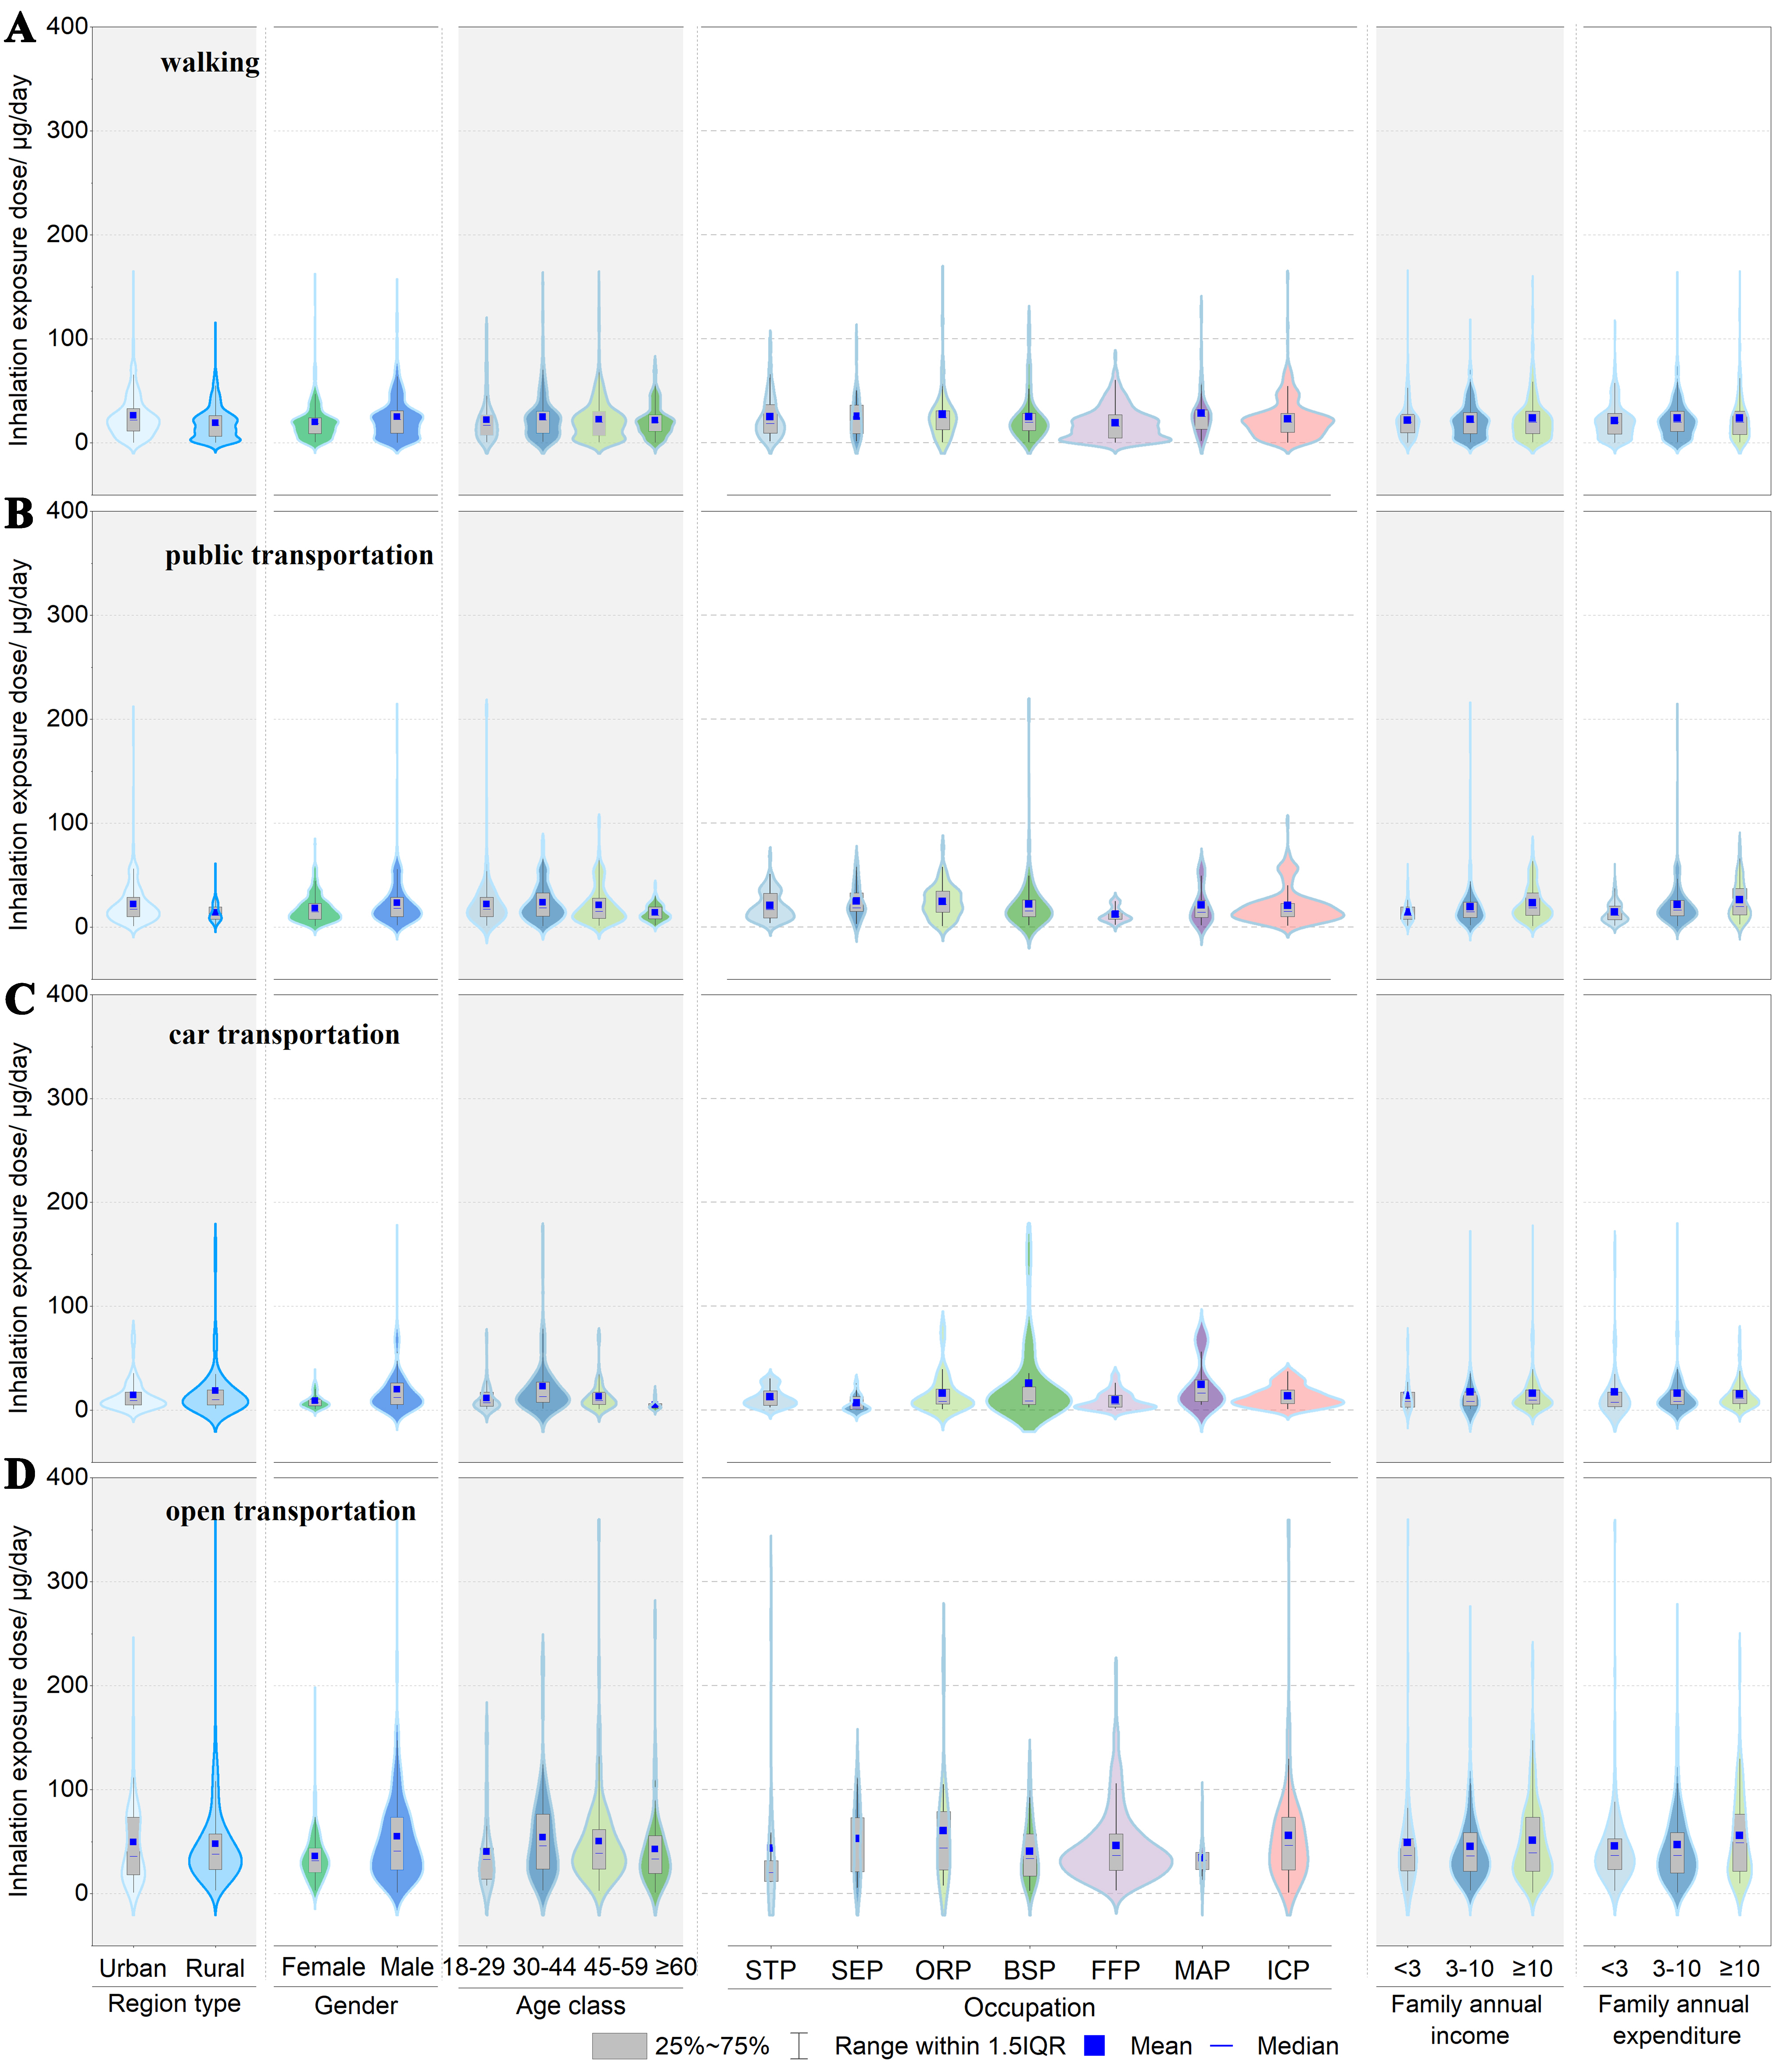
Figure 3. Daily exposure dose by transportation mode across subgroups. (A) Walking; (B) public transportation; (C) car transportation; and (D) open transportation. Family annual income and expenditure are presented in units of 10,000 CNY. STP: Scientific and technical personnel; SEP: social and economic personnel; ORP: officers and related personnel; BSP: business and services personnel; FFP: agricultural personnel; MAP: manufacturing personnel; ICP: inconvenient-to-classify personnel.
Characteristics, influencing factors and disparities in traffic-related activity patterns
Traffic-related activity is a common indicator for estimating individuals’ exposure to air pollution[22,23]. Using data from three rounds of surveys conducted among residents in Lanzhou, China, we systematically examined the distribution and determinants of transportation mode choice and time allocation. The findings highlight the significant influence of sociodemographic characteristics, regional typologies, and built environment features on transportation behavior.
Compared with international data, the proportion of walking in Lanzhou (> 70%) was considerably higher than that in England (10.9%)[52] and the U.S. (64%)[26], reflecting the prevalence of short-distance travel. Conversely, public transportation usage in Hong Kong[53] and Shanghai[29] (70% and 46.7%, respectively) exceeded that in Lanzhou, likely due to the presence of more extensive and efficient transit systems in those cities.
Although cars were not the most frequently used mode of transport, they accounted for the longest average daily travel time - over 60 min per day. This is consistent with findings from the 2013 Chinese Environmental Exposure-Related Human Activity Patterns Survey-Adult (CEERHAPS-A) in northwestern China[54], and it reflects longer commuting distances[55], especially in rural areas. The observed mismatch between mode usage and travel time - for instance, increased usage but decreased time spent on open transportation in 2016-2018 - suggests a partial substitution effect among transportation modes.
The emergence of shared mobility services contributed to these shifts. Since 2016, Lanzhou has seen a rapid increase in shared bicycle use, with over 300,000 bikes deployed by the end of 2017[56,57]. This change in short-distance travel modes may have reduced time spent on public transport and walking[44,57-59]. While shared bikes support environmentally friendly travel, they also expose users to near-road air pollution and higher inhalation risks.
Disparities between urban and rural areas in infrastructure development and access to transit largely account for differences in transportation mode use[29,44,60]. The launch of metro services, such as Lanzhou Metro Line 1 in 2019, has improved access to public transport and helped reduce travel times. Higher-income groups were more likely to use private cars due to greater car ownership[31] and tended to spend more time commuting.
Transportation choices were also influenced by gender, age, and occupation. Males were more likely to use cars and open transportation, while older adults preferred public transport - a pattern consistent with findings from the 2001 and 2017 U.S. National Household Travel Surveys[61]. High-income individuals were more likely to use open transportation but spent less time using it, likely due to their heightened sensitivity to transportation duration[31]. The presence or absence of main roads near homes or workplaces significantly affected both mode choice and travel time[26,62], particularly for public transportation and walking.
Multivariate analyses further revealed temporal changes in the dominant influencing factors. In 2015 and 2016-2018, RT was the strongest predictor of walking time, while in 2020, occupation became the most significant factor. These shifts suggest that evolving social structures, infrastructure, and public services play a critical role in reshaping transportation behavior over time.
Impact of traffic-related behavior on PM2.5 inhalation exposure and public health implications
We quantitatively assessed how transportation activity patterns contribute to cumulative daily PM2.5 inhalation exposure. Time spent in transit was identified as the most influential factor, accounting for over 96% of the variation in exposure across all transportation modes. This finding aligns with similar studies conducted in cities such as Xi’an[63].
Pollutant concentrations varied markedly across different transportation microenvironments, resulting in a disconnect between time spent and total exposure dose. Although car transportation had the longest average duration, it resulted in the lowest exposure owing to cleaner in-vehicle air. In contrast, open transportation modes, such as bicycling, generated the highest exposure doses. This was attributable to both elevated ambient PM2.5 levels from proximity to traffic emissions[15,36,46,64,65] and increased inhalation rates associated with physical exertion. In fact, the exposure dose from open modes of transport was more than twice that of walking. Some studies even reported that open transport modes had higher exposure doses than all other transportation types[48].
Thus, neither transportation time nor pollutant concentration alone can fully explain differences in exposure. Both factors must be considered alongside inhalation rate[63]. For example, cyclists typically have inhalation rates two to five times higher than car passengers[66], leading to increased respiratory deposition of airborne pollutants[20].
Notable disparities in pollutant exposure were also observed across genders and age groups, largely due to physiological differences in inhalation rates[63]. Greater physical exertion leads to higher inhalation rates and thus increased pollutant deposition in the lungs[20]. For example, females and older adults tend to have lower inhalation rates, resulting in lower exposure doses compared to males and younger individuals.
From a health risk prevention perspective, reducing the time spent in high-exposure transportation modes is essential[67]. Urban planning should therefore not only encourage active transportation but also focus on minimizing pollution exposure along such routes. Practical measures include relocating bike lanes away from major roads - which can reduce exposure by 15%-75%[68] - and enhancing air quality at public transit hubs through improved ventilation or filtration systems.
Limitations and future directions
Several limitations should be acknowledged. The survey-based approach may be subject to recall bias, and uncertainties may arise from self-reported transportation behaviors and time-use patterns, which are prone to reporting errors or variations in participant interpretation. Additionally, the focus on a single inland city (Lanzhou) may limit the generalizability of our findings to other regions. Furthermore, the use of annual average PM2.5 concentrations may not adequately capture significant seasonal variations, particularly elevated levels during the winter months, potentially leading to an underestimation of peak exposure periods. Given the rapidly evolving transportation landscape, ongoing monitoring is essential. Future research should incorporate real-time exposure measurements and behavioral tracking while accounting for seasonal variability to improve the accuracy and applicability of exposure estimates. Longitudinal studies tracking individual-level behavioral changes could also offer valuable insights into evolving transportation patterns and their implications for environmental exposure and health outcomes.
CONCLUSIONS
We conducted a comprehensive analysis of transportation mode choices, time-use patterns, and their impacts on daily cumulative PM2.5 inhalation exposure in Lanzhou, China. Walking was the dominant mode of transportation, accounting for over 70% of use, while car transportation had the longest average duration, exceeding 60 min per day. However, exposure doses varied significantly across transportation modes. Open-air transportation modes resulted in the highest cumulative inhaled PM2.5 dose (48.40 μg/day), due to elevated pollutant concentrations and higher inhalation rates, while car transportation resulted in the lowest dose (16.20 μg/day), despite its longer duration. These findings underscore the importance of integrating transportation behavior data into traffic-related exposure assessment frameworks. Our results can inform urban planning, public health interventions, and policy strategies aimed at designing low-exposure travel routes, improving infrastructure for active transport, and reducing TRAP risks in urban environments.
DECLARATIONS
Authors’ contributions
Conceptualization, investigation, visualization, sampling, data curation, data cleansing, writing - original draft preparation, review and editing, validation: Wang, D.
Conceptualization, writing - original draft preparation, review and editing, formal analysis, validation: Hou, Y.; Wang, Y.
Conceptualization, resources, writing - review and editing, supervision, project administration, funding acquisition: Zhao, X.
Resources, writing - review and editing, supervision, project administration: Ding, Y.
Availability of data and materials
The data supporting the findings of this study are available within this article and its Supplementary Materials.
Financial support and sponsorship
This work was supported by the National Key R&D Program of China (No. 2019YFE0115100) and State Environmental Protection Key Laboratory of Vehicle Emission Control and Simulation (No. VECS2021S04).
Conflicts of interest
All authors declared that there are no conflicts of interest.
Ethical approval and consent to participate
The surveys in this study were regionally representative cross-studies covering the urban and rural areas of Lanzhou and were all approved by the Ethics Committees of School of Public Health, Lanzhou University (NO.2015.9.9) and School of Public Health, Tongji Medical College Huazhong University of Science and Technology (NO. [2015] 13).
Consent for publication
Not applicable.
Copyright
© The Author(s) 2025.
Supplementary Materials
REFERENCES
1. Mandalakis, M.; Stephanou, E. G.; Horii, Y.; Kannan, K. Emerging contaminants in car interiors: evaluating the impact of airborne PBDEs and PBDD/Fs. Environ. Sci. Technol. 2008, 42, 6431-6.
2. Saraswat, A.; Kandlikar, M.; Brauer, M.; Srivastava, A. PM2.5 population exposure in new delhi using a probabilistic simulation framework. Environ. Sci. Technol. 2016, 50, 3174-83.
3. Ma, X.; Longley, I.; Gao, J.; Salmond, J. Evaluating the effect of ambient concentrations, route choices, and environmental (in)justice on students’ dose of ambient NO2 while walking to school at population scales. Environ. Sci. Technol. 2020, 54, 12908-19.
4. Künzli, N.; Kaiser, R.; Medina, S.; et al. Public-health impact of outdoor and traffic-related air pollution: a European assessment. Lancet 2000, 356, 795-801.
5. Garcia, L.; Johnson, R.; Johnson, A.; et al. Health impacts of changes in travel patterns in Greater Accra Metropolitan Area, Ghana. Environ. Int. 2021, 155, 106680.
6. Beelen, R.; Hoek, G.; van den Brandt, P. A.; et al. Long-term effects of traffic-related air pollution on mortality in a Dutch cohort (NLCS-AIR study). Environ. Health. Perspect. 2008, 116, 196-202.
7. Celis-Morales, C. A.; Lyall, D. M.; Welsh, P.; et al. Association between active commuting and incident cardiovascular disease, cancer, and mortality: prospective cohort study. BMJ 2017, 357, j1456.
8. Nordling, E.; Berglind, N.; Melén, E.; et al. Traffic-related air pollution and childhood respiratory symptoms, function and allergies. Epidemiology 2008, 19, 401-8.
9. Aziz, K.; Ali, Z.; Nasir, Z. A.; Colbeck, I. Comparative study of particulate matter in the transport microenvironment (buses) of Pakistan and UK. J. Anim. Plant. Sci. 2015, 25, 636-43. http://dspace.lib.cranfield.ac.uk/handle/1826/14164. (accessed 18 Jul 2025).
10. Brauer, M.; Lencar, C.; Tamburic, L.; Koehoorn, M.; Demers, P.; Karr, C. A cohort study of traffic-related air pollution impacts on birth outcomes. Environ. Health. Perspect. 2008, 116, 680-6.
11. McConnell, R.; Islam, T.; Shankardass, K.; et al. Childhood incident asthma and traffic-related air pollution at home and school. Environ. Health. Perspect. 2010, 118, 1021-6.
12. Min, K. D.; Yi, S. J.; Kim, H. C.; et al. Association between exposure to traffic-related air pollution and pediatric allergic diseases based on modeled air pollution concentrations and traffic measures in Seoul, Korea: a comparative analysis. Environ. Health. 2020, 19, 6.
13. Ma, X.; Longley, I.; Gao, J.; Kachhara, A.; Salmond, J. A site-optimised multi-scale GIS based land use regression model for simulating local scale patterns in air pollution. Sci. Total. Environ. 2019, 685, 134-49.
14. Forehead, H.; Huynh, N. Review of modelling air pollution from traffic at street-level - The state of the science. Environ. Pollut. 2018, 241, 775-86.
15. Singh, V.; Meena, K. K.; Agarwal, A. Travellers’ exposure to air pollution: a systematic review and future directions. Urban. Climate. 2021, 38, 100901.
16. Goel, R.; Gani, S.; Guttikunda, S. K.; Wilson, D.; Tiwari, G. On-road PM2.5 pollution exposure in multiple transport microenvironments in Delhi. Atmos. Environ. 2015, 123, 129-38.
17. Harrad, S.; Hazrati, S.; Ibarra, C. Concentrations of polychlorinated biphenyls in indoor air and polybrominated diphenyl ethers in indoor air and dust in Birmingham, United Kingdom: implications for human exposure. Environ. Sci. Technol. 2006, 40, 4633-8.
18. Abdillah, S. F. I.; You, S. J.; Wang, Y. F. Characterizing sector-oriented roadside exposure to ultrafine particles (PM0.1) via machine learning models: Implications of covariates influences on sectors variability. Environ. Pollut. 2024, 359, 124595.
19. Yang, F.; Kaul, D.; Wong, K. C.; et al. Heterogeneity of passenger exposure to air pollutants in public transport microenvironments. Atmos. Environ. 2015, 109, 42-51.
20. Borghi, F.; Spinazzè, A.; Fanti, G.; et al. Commuters’ personal exposure assessment and evaluation of inhaled dose to different atmospheric pollutants. Int. J. Environ. Res. Public. Health. 2020, 17, 3357.
21. de Kluizenaar, Y.; Kuijpers, E.; Eekhout, I.; et al. Personal exposure to UFP in different micro-environments and time of day. Build. Environ. 2017, 122, 237-46.
22. Dons, E.; Int Panis, L.; Van Poppel, M.; Theunis, J.; Wets, G. Personal exposure to Black Carbon in transport microenvironments. Atmos. Environ. 2012, 55, 392-8.
23. Dons, E.; Int Panis, L.; Van Poppel, M.; et al. Impact of time-activity patterns on personal exposure to black carbon. Atmos. Environ. 2011, 45, 3594-602.
24. Shafran-Nathan, R.; Yuval,
25. Rind, E.; Shortt, N.; Mitchell, R.; Richardson, E. A.; Pearce, J. Are income-related differences in active travel associated with physical environmental characteristics? A multi-level ecological approach. Int. J. Behav. Nutr. Phys. Act. 2015, 12, 73.
26. Watson, K. B.; Whitfield, G. P.; Bricka, S.; Carlson, S. A. Purpose-based walking trips by duration, distance, and select characteristics, 2017 National Household Travel Survey. J. Phys. Act. Health. 2021, 18, S86-93.
27. Gong, W.; Yuan, F.; Feng, G.; et al. Trends in transportation modes and time among Chinese population from 2002 to 2012. Int. J. Environ. Res. Public. Health. 2020, 17, 945.
28. D’Agostino, E. M.; Armstrong, S. C.; Alexander, E. P.; Østbye, T.; Neshteruk, C. D.; Skinner, A. C. Predictors and patterns of physical activity from transportation among United States Youth, 2007-2016. J. Adolesc. Health. 2021, 69, 263-71.
29. Liu, X.; Gao, L.; Ni, A.; Ye, N. Understanding better the influential factors of commuters’ multi-day travel behavior: evidence from Shanghai, China. Sustainability 2020, 12, 376.
30. Branion-Calles, M.; Teschke, K.; Koehoorn, M.; Espin-Garcia, O.; Harris, M. A. Estimating walking and bicycling in Canada and their road collision fatality risks: the need for a national household travel survey. Prev. Med. Rep. 2021, 22, 101366.
31. Yang, Y.; Wang, C.; Liu, W.; Zhou, P. Understanding the determinants of travel mode choice of residents and its carbon mitigation potential. Energy. Policy. 2018, 115, 486-93.
32. Nguyen-Phuoc, D. Q.; Amoh-Gyimah, R.; Tran, A. T. P.; Phan, C. T. Mode choice among university students to school in Danang, Vietnam. Travel. Behav. Soc. 2018, 13, 1-10.
33. Li, J.; Lo, K.; Guo, M. Do Socio-economic characteristics affect travel behavior? A comparative study of low-carbon and non-low-carbon shopping travel in Shenyang City, China. Int. J. Environ. Res. Public. Health. 2018, 15, 1346.
34. Yu, C. Y.; Lin, H. C. Exploring factors regarding transit-related walking and walking duration. J. Phys. Act. Health. 2016, 13, 1220-9.
35. Greaves, S. P. Capturing the spatiotemporal variability of fine particulates in travel microenvironments using GPS technology. In Proceedings of the 12th International Conference on Urban Transport and the Environment in the 21st Century, Prague, Czech republic. Jul 12-14, 2006. pp. 849-58.
36. Mitsakou, C.; Adamson, J. P.; Doutsi, A.; et al. Assessing the exposure to air pollution during transport in urban areas - evidence review. J. Transp. Health. 2021, 21, 101064.
37. Kaur, S.; Nieuwenhuijsen, M.; Colvile, R. Fine particulate matter and carbon monoxide exposure concentrations in urban street transport microenvironments. Atmos. Environ. 2007, 41, 4781-810.
38. Miao, Q.; Bouchard, M.; Chen, D.; Rosenberg, M. W.; Aronson, K. J. Commuting behaviors and exposure to air pollution in Montreal, Canada. Sci. Total. Environ. 2015, 508, 193-8.
39. Suárez, L.; Mesías, S.; Iglesias, V.; Silva, C.; Cáceres, D. D.; Ruiz-Rudolph, P. Personal exposure to particulate matter in commuters using different transport modes (bus, bicycle, car and subway) in an assigned route in downtown Santiago, Chile. Environ. Sci. Process. Impacts. 2014, 16, 1309-17.
40. Tsai, D. H.; Wu, Y. H.; Chan, C. C. Comparisons of commuter’s exposure to particulate matters while using different transportation modes. Sci. Total. Environ. 2008, 405, 71-7.
41. Adams, H.; Nieuwenhuijsen, M.; Colvile, R.; Older, M.; Kendall, M. Assessment of road users’ elemental carbon personal exposure levels, London, UK. Atmos. Environ. 2002, 36, 5335-42.
42. Wu, D.; Lin, M.; Chan, C.; et al. Influences of commuting mode, air conditioning mode and meteorological parameters on fine particle (PM2.5) exposure levels in traffic microenvironments. Aerosol. Air. Qual. Res. 2013, 13, 709-20.
43. Jiang, N.; Qi, L.; Wang, B.; et al. Traffic related activity pattern of Chinese adults: a nation-wide population based survey. J. Expo. Sci. Environ. Epidemiol. 2023, 33, 482-9.
44. Wu, L.; Wang, W.; Jing, P.; et al. Travel mode choice and their impacts on environment - a literature review based on bibliometric and content analysis, 2000-2018. J. Clean. Prod. 2020, 249, 119391.
45. Feng, J.; Dijst, M.; Wissink, B.; Prillwitz, J. Changing travel behaviour in urban China: evidence from Nanjing 2008-2011. Transp. Policy. 2017, 53, 1-10.
46. Boniardi, L.; Borghi, F.; Straccini, S.; et al. Commuting by car, public transport, and bike: exposure assessment and estimation of the inhaled dose of multiple airborne pollutants. Atmos. Environ. 2021, 262, 118613.
47. EPA. Exposure factors handbook (2011 edition). https://www.epa.gov/expobox/exposure-factors-handbook-2011-edition. (accessed 18 Jul 2025).
48. Li, Y.; Fan, Z.; Li, K.; Wu, D. Commuter exposure to PM2.5 and its influencing factors in different commuting modes. Environ. Chem. 2015, 34, 1408-16. https://caod.oriprobe.com/articles/46834431/Commuter_exposure_to_PM2_5_and_its_influencing_fac.htm. (accessed 18 Jul 2025).
49. Lanzhou Ecology and Environment Bureau. Report on the State of the Environment. https://sthjj.lanzhou.gov.cn/col/col5758/index.html. (accessed 18 Jul 2025).
50. McNabola, A.; Broderick, B. M.; Gill, L. W. A principal components analysis of the factors effecting personal exposure to air pollution in urban commuters in Dublin, Ireland. J. Environ. Sci. Health. A. Tox. Hazard. Subst. Environ. Eng. 2009, 44, 1219-26.
51. Qiu, Z.; Song, J.; Xu, X.; et al. Commuter exposure to particulate matter for different transportation modes in Xi’an, China. Atmos. Pollut. Res. 2017, 8, 940-8.
52. Goodman, A. Walking, cycling and driving to work in the English and Welsh 2011 census: trends, socio-economic patterning and relevance to travel behaviour in general. PLoS. One. 2013, 8, e71790.
53. Gali, N. K.; Jiang, S. Y.; Yang, F.; Sun, L.; Ning, Z. Redox characteristics of size-segregated PM from different public transport microenvironments in Hong Kong. Air. Qual. Atmos. Health. 2017, 10, 833-44.
54. Duan, X.; Zhao, X.; Wang, B.; Chen, Y.; Cao, S. 5 - Time-activity factors related to air exposure. In Highlights of the Chinese Exposure Factors Handbook (Adults). Academic Press: 2015; pp. 31-9. https://www.researchgate.net/publication/294645842_Highlights_of_the_Chinese_Exposure_Factors_HandbookAdults. (accessed 18 Jul 2025).
55. Zulauf, N.; Dröge, J.; Klingelhöfer, D.; Braun, M.; Oremek, G. M.; Groneberg, D. A. Indoor air pollution in cars: an update on novel insights. Int. J. Environ. Res. Public. Health. 2019, 16, 2441.
56. Jin, H.; Jin, F.; Wang, J.; Sun, W.; Dong, L. Competition and cooperation between shared bicycles and public transit: a case study of Beijing. Sustainability 2019, 11, 1323.
57. Ji, W.; Lu, C.; Mao, J.; Liu, Y.; Hou, M.; Pan, X. Public’s intention and influencing factors of dockless bike-sharing in central urban areas: a case study of Lanzhou City, China. Sustainability 2021, 13, 9265.
58. Campbell, K. B.; Brakewood, C. Sharing riders: how bikesharing impacts bus ridership in New York City. Transp. Res. Part. A. Policy. Pract. 2017, 100, 264-82.
59. Cao, M.; Ma, S.; Huang, M.; Lü, G.; Chen, M. Effects of free-floating shared bicycles on urban public transportation. IJGI 2019, 8, 323.
60. Zhou, X.; Liang, J.; Ji, X.; Cottrill, C. D. The influence of information services on public transport behavior of urban and rural residents. Sustainability 2019, 11, 5454.
61. Lidbe, A.; Adanu, E. K.; Penmetsa, P.; Jones, S. Changes in the travel patterns of older Americans with medical conditions: a comparison of 2001 and 2017 NHTS data. Transp. Res. Interdiscip. Perspect. 2021, 11, 100463.
62. Gascon, M.; Götschi, T.; de Nazelle, A.; et al. Correlates of walking for travel in seven European cities: the PASTA Project. Environ. Health. Perspect. 2019, 127, 97003.
63. Qiu, Z.; Lv, H.; Zhang, F.; Wang, W.; Hao, Y. Pedestrian exposure to PM2.5, BC and UFP of adults and teens: a case study in Xi’an, China. Sustain. Cities. Soc. 2019, 51, 101774.
64. Gilliland, J.; Maltby, M.; Xu, X.; Luginaah, I.; Shah, T. Influence of the natural and built environment on personal exposure to fine particulate matter (PM2.5) in cyclists using city designated bicycle routes. Urban. Sci. 2018, 2, 120.
65. Okokon, E. O.; Yli-Tuomi, T.; Turunen, A. W.; et al. Particulates and noise exposure during bicycle, bus and car commuting: a study in three European cities. Environ. Res. 2017, 154, 181-9.
66. Bigazzi, A. Y.; Figliozzi, M. A. Review of urban bicyclists’ intake and uptake of traffic-related air pollution. Transp. Rev. 2014, 34, 221-45.
67. Hatzopoulou, M.; Weichenthal, S.; Barreau, G.; et al. A web-based route planning tool to reduce cyclists’ exposures to traffic pollution: a case study in Montreal, Canada. Environ. Res. 2013, 123, 58-61.
Cite This Article
How to Cite
Download Citation
Export Citation File:
Type of Import
Tips on Downloading Citation
Citation Manager File Format
Type of Import
Direct Import: When the Direct Import option is selected (the default state), a dialogue box will give you the option to Save or Open the downloaded citation data. Choosing Open will either launch your citation manager or give you a choice of applications with which to use the metadata. The Save option saves the file locally for later use.
Indirect Import: When the Indirect Import option is selected, the metadata is displayed and may be copied and pasted as needed.
About This Article
Special Issue
Copyright

Data & Comments
Data
0


Comments
Comments must be written in English. Spam, offensive content, impersonation, and private information will not be permitted. If any comment is reported and identified as inappropriate content by OAE staff, the comment will be removed without notice. If you have any queries or need any help, please contact us at [email protected].