

fig2
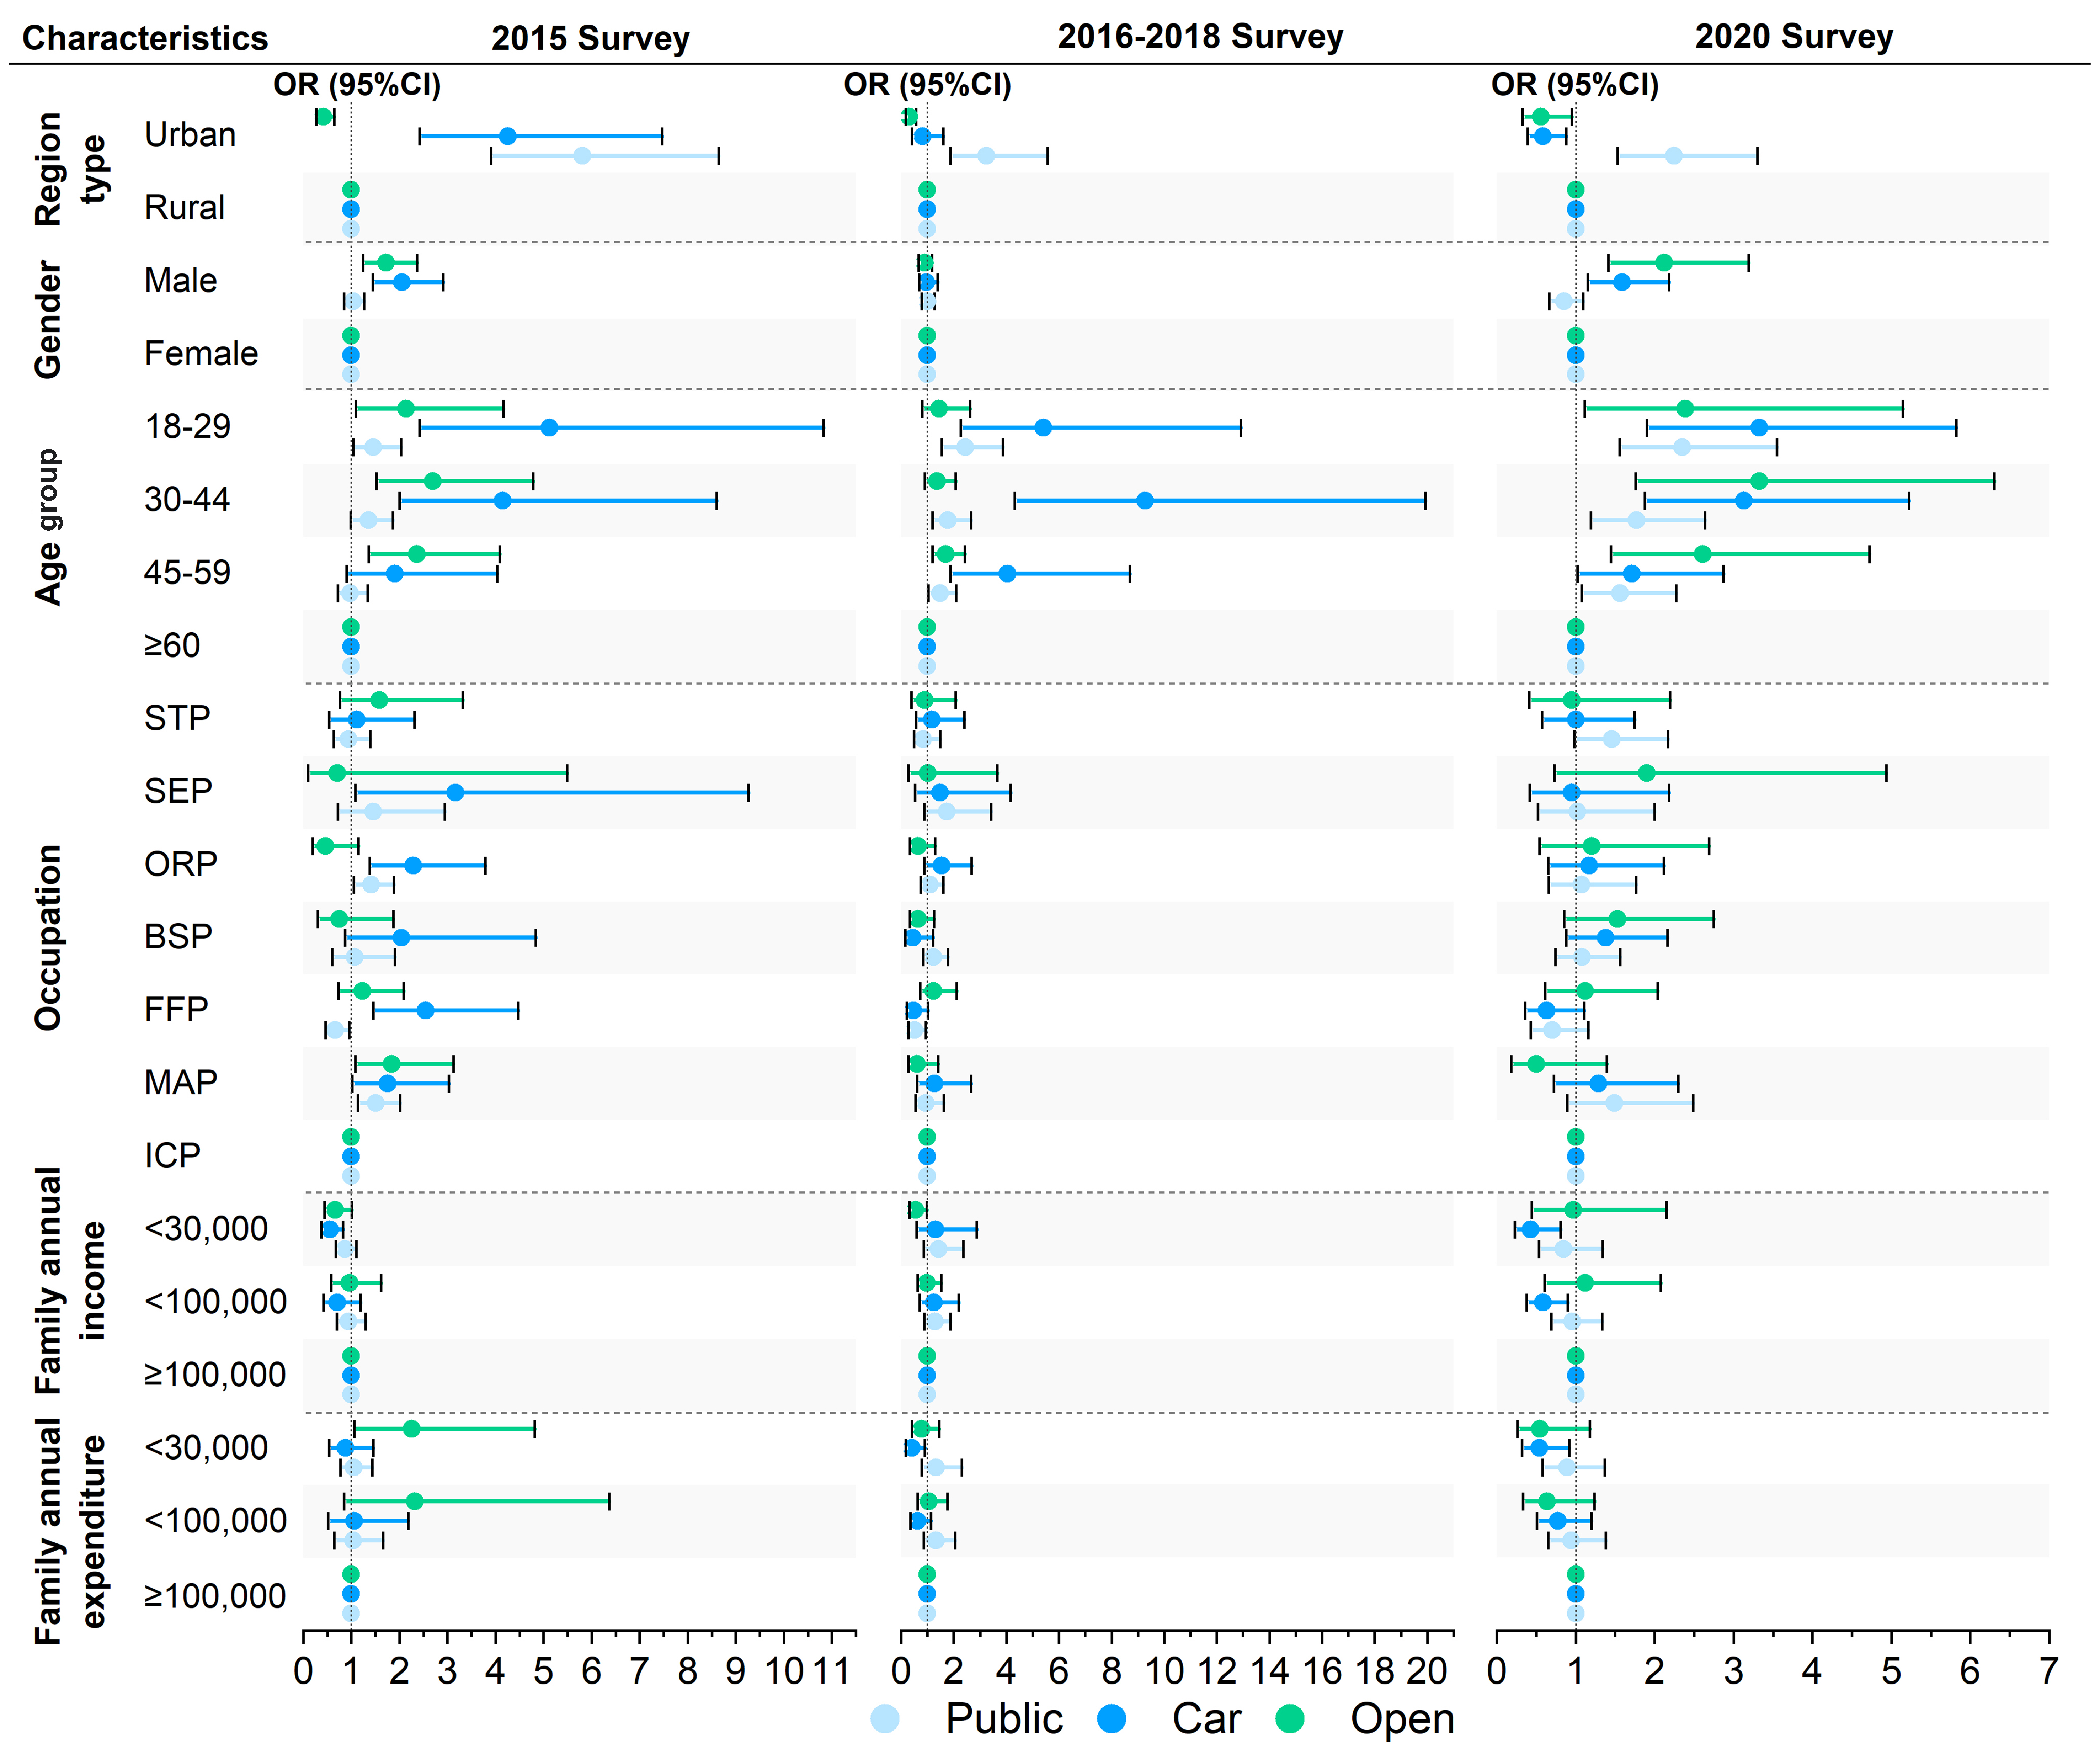
Figure 2. Associations between transportation modes and sociodemographic characteristics. Family annual income and expenditure are expressed in CNY. Walking was used as the reference transportation mode. STP: Scientific and technical personnel; SEP: social and economic personnel; ORP: officers and related personnel; BSP: business and services personnel; FFP: agricultural personnel; MAP: manufacturing personnel; ICP: inconvenient-to-classify personnel.


