

fig2
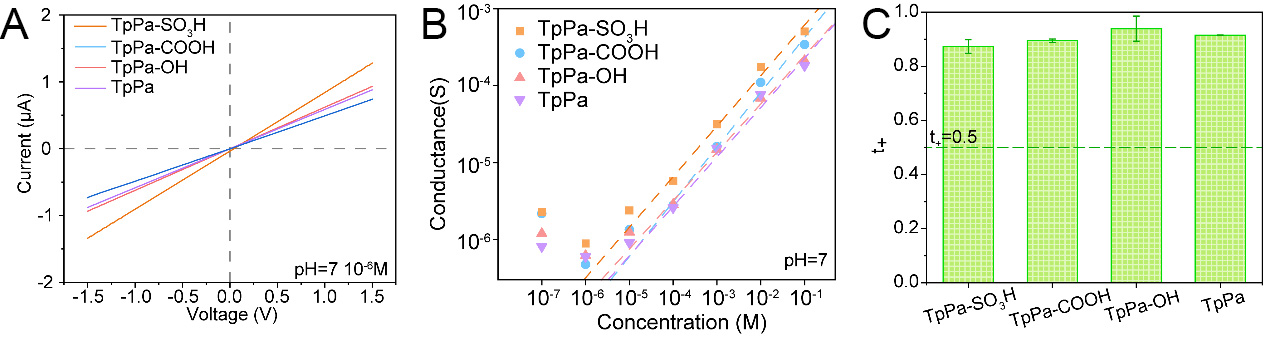
Figure 2. (A) Representative I-V curves of the four membranes in 10-6 M KCl at pH 7; (B) Ionic conductance as a function of KCl concentration (10-7 to 10-1 M) at pH 7; (C) Cation transference numbers (t+) measured under a tenfold KCl concentration gradient (10-3 M vs. 10-2 M) at pH 7. Error bars in (C) represent the standard deviation obtained from five independent measurements for each sample.