
fig2
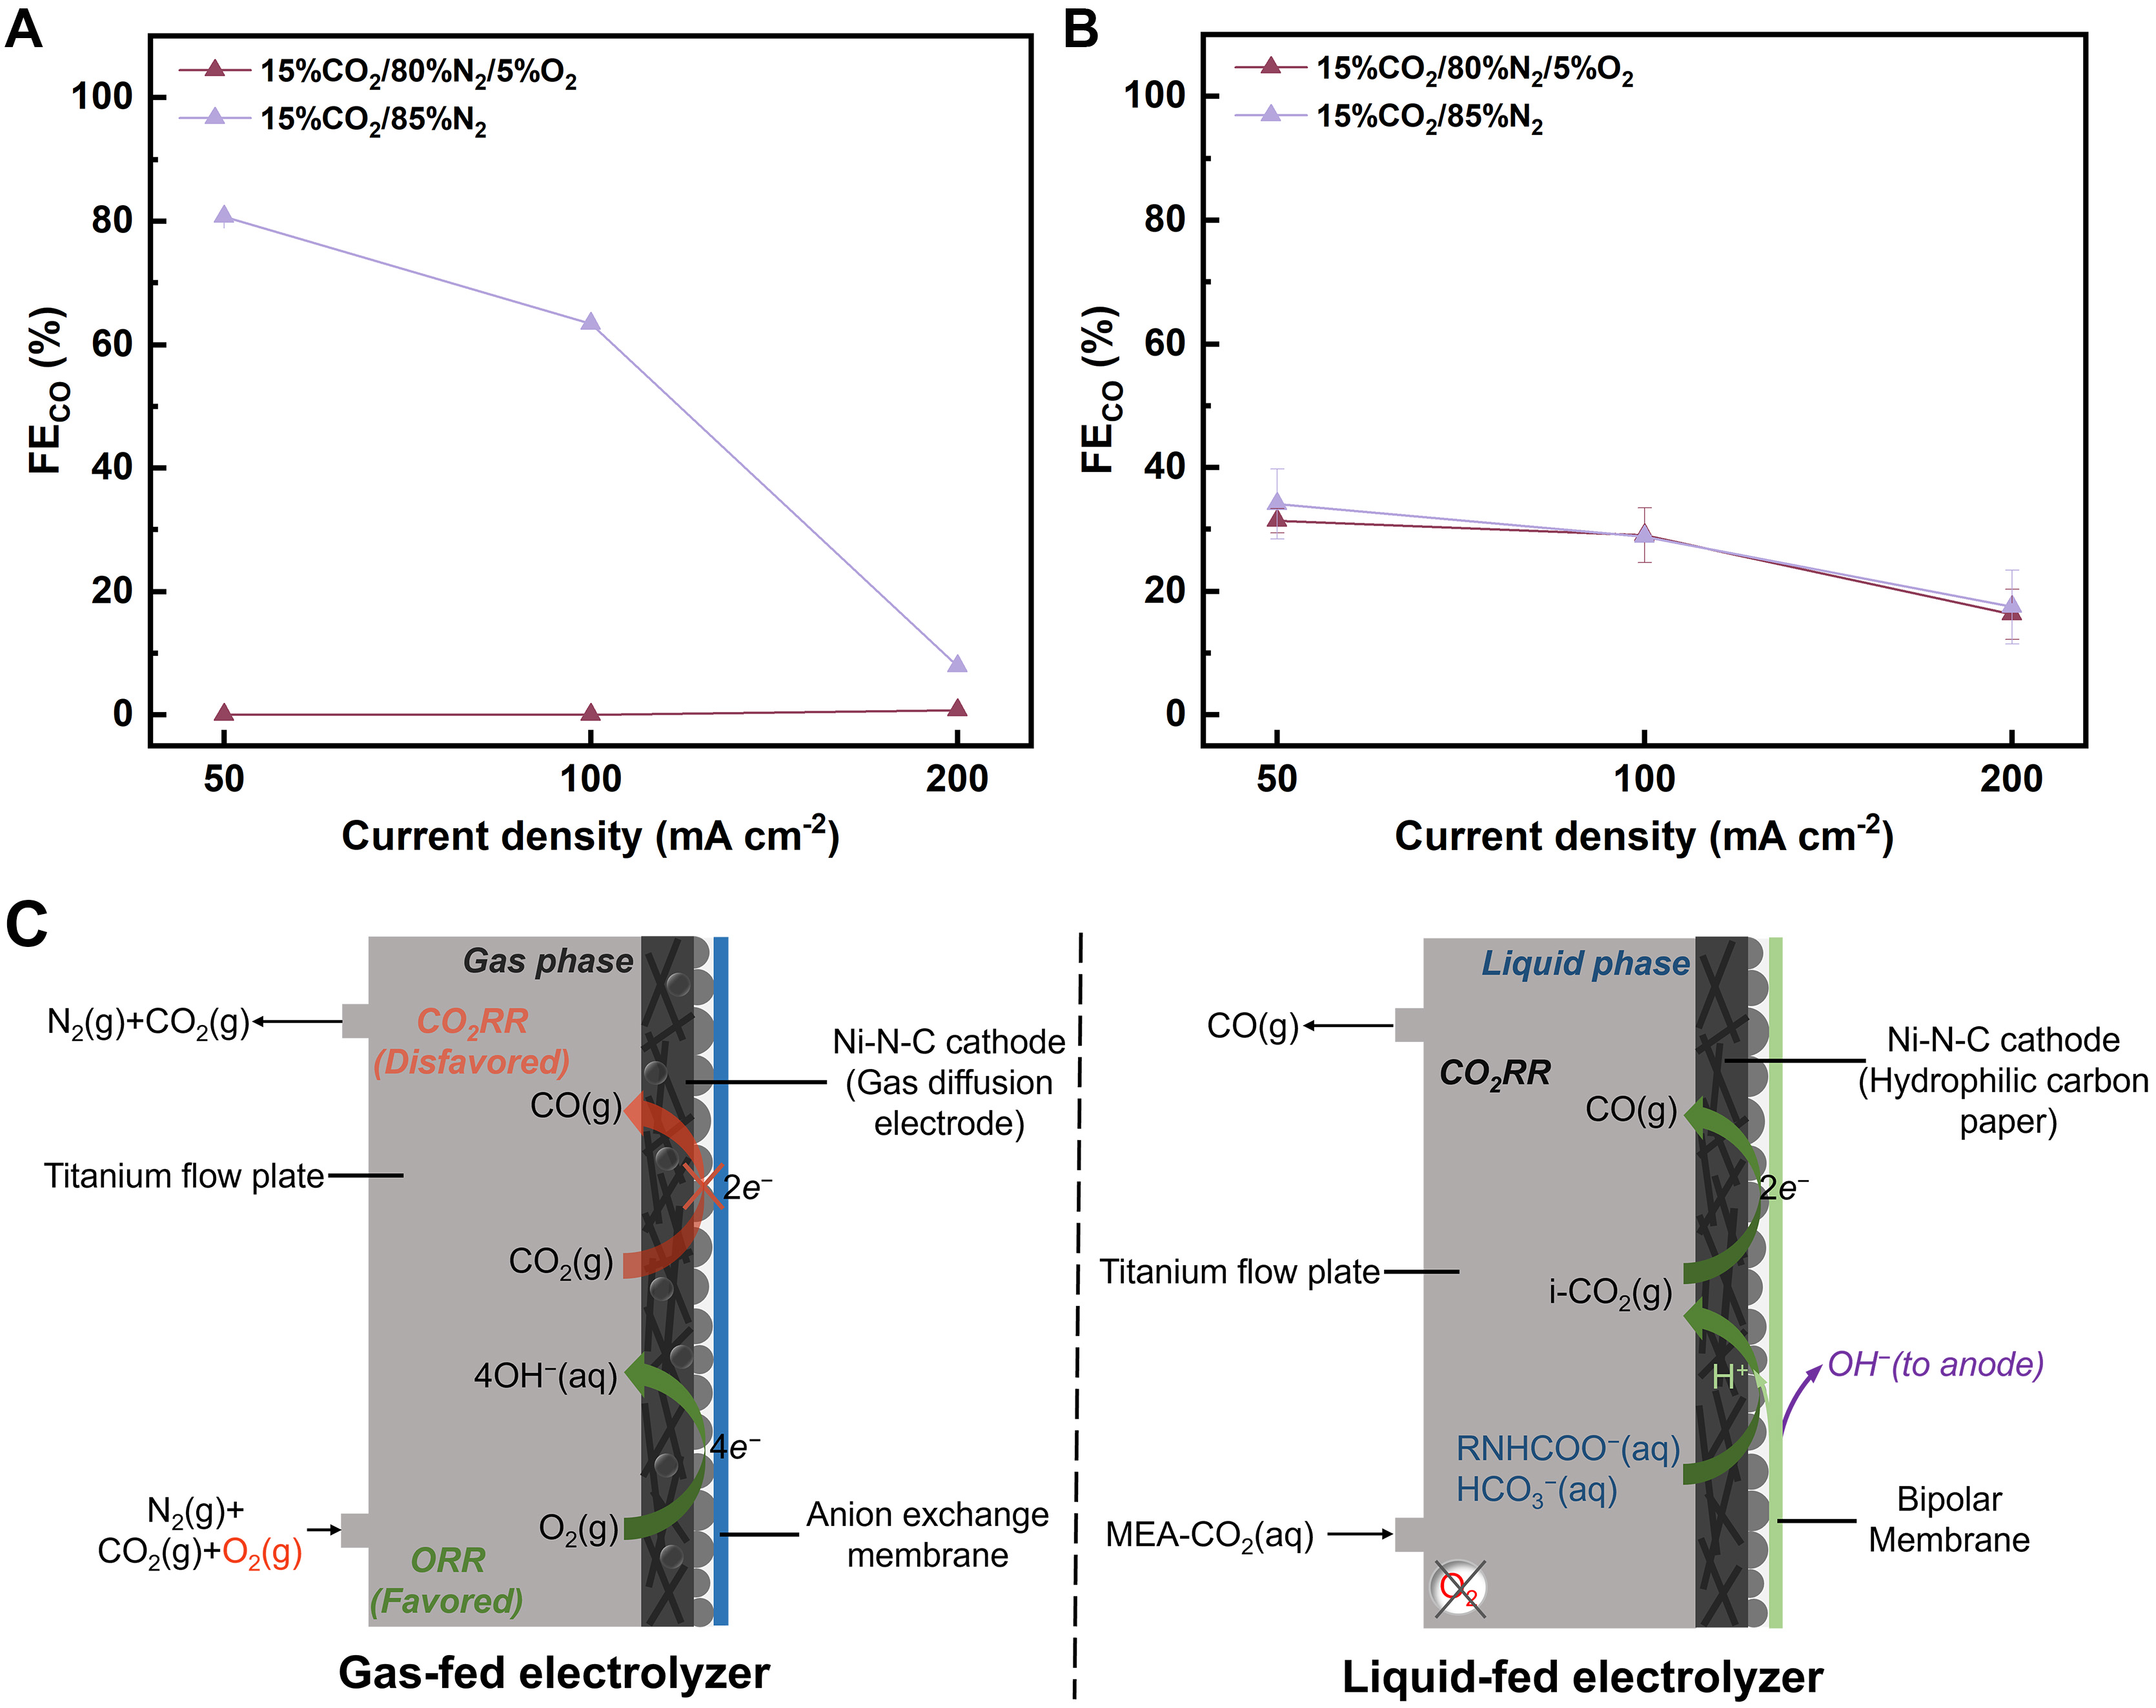
Figure 2. FECO recorded for electrolysis of (A) 15% CO2/80% N2/5% O2 and 15% CO2/85% N2 in the gas-fed electrolyzer and (B) CO2-capturing 5 M MEA under 15% CO2/80% N2/5% O2 and 15% CO2/85% N2 atmosphere in the liquid-fed electrolyzer. The error bars represent the standard deviation of two independent measurements; (C) Schematic diagrams of reaction processes in the cathodic chambers of the gas-fed and liquid-fed electrolyzers. FE: Faraday efficiencies; FECO: Faraday efficiency for CO; MEA: monoethanolamine; CO2RR: CO2 reduction reaction; ORR: oxygen reduction reaction.

