

fig4
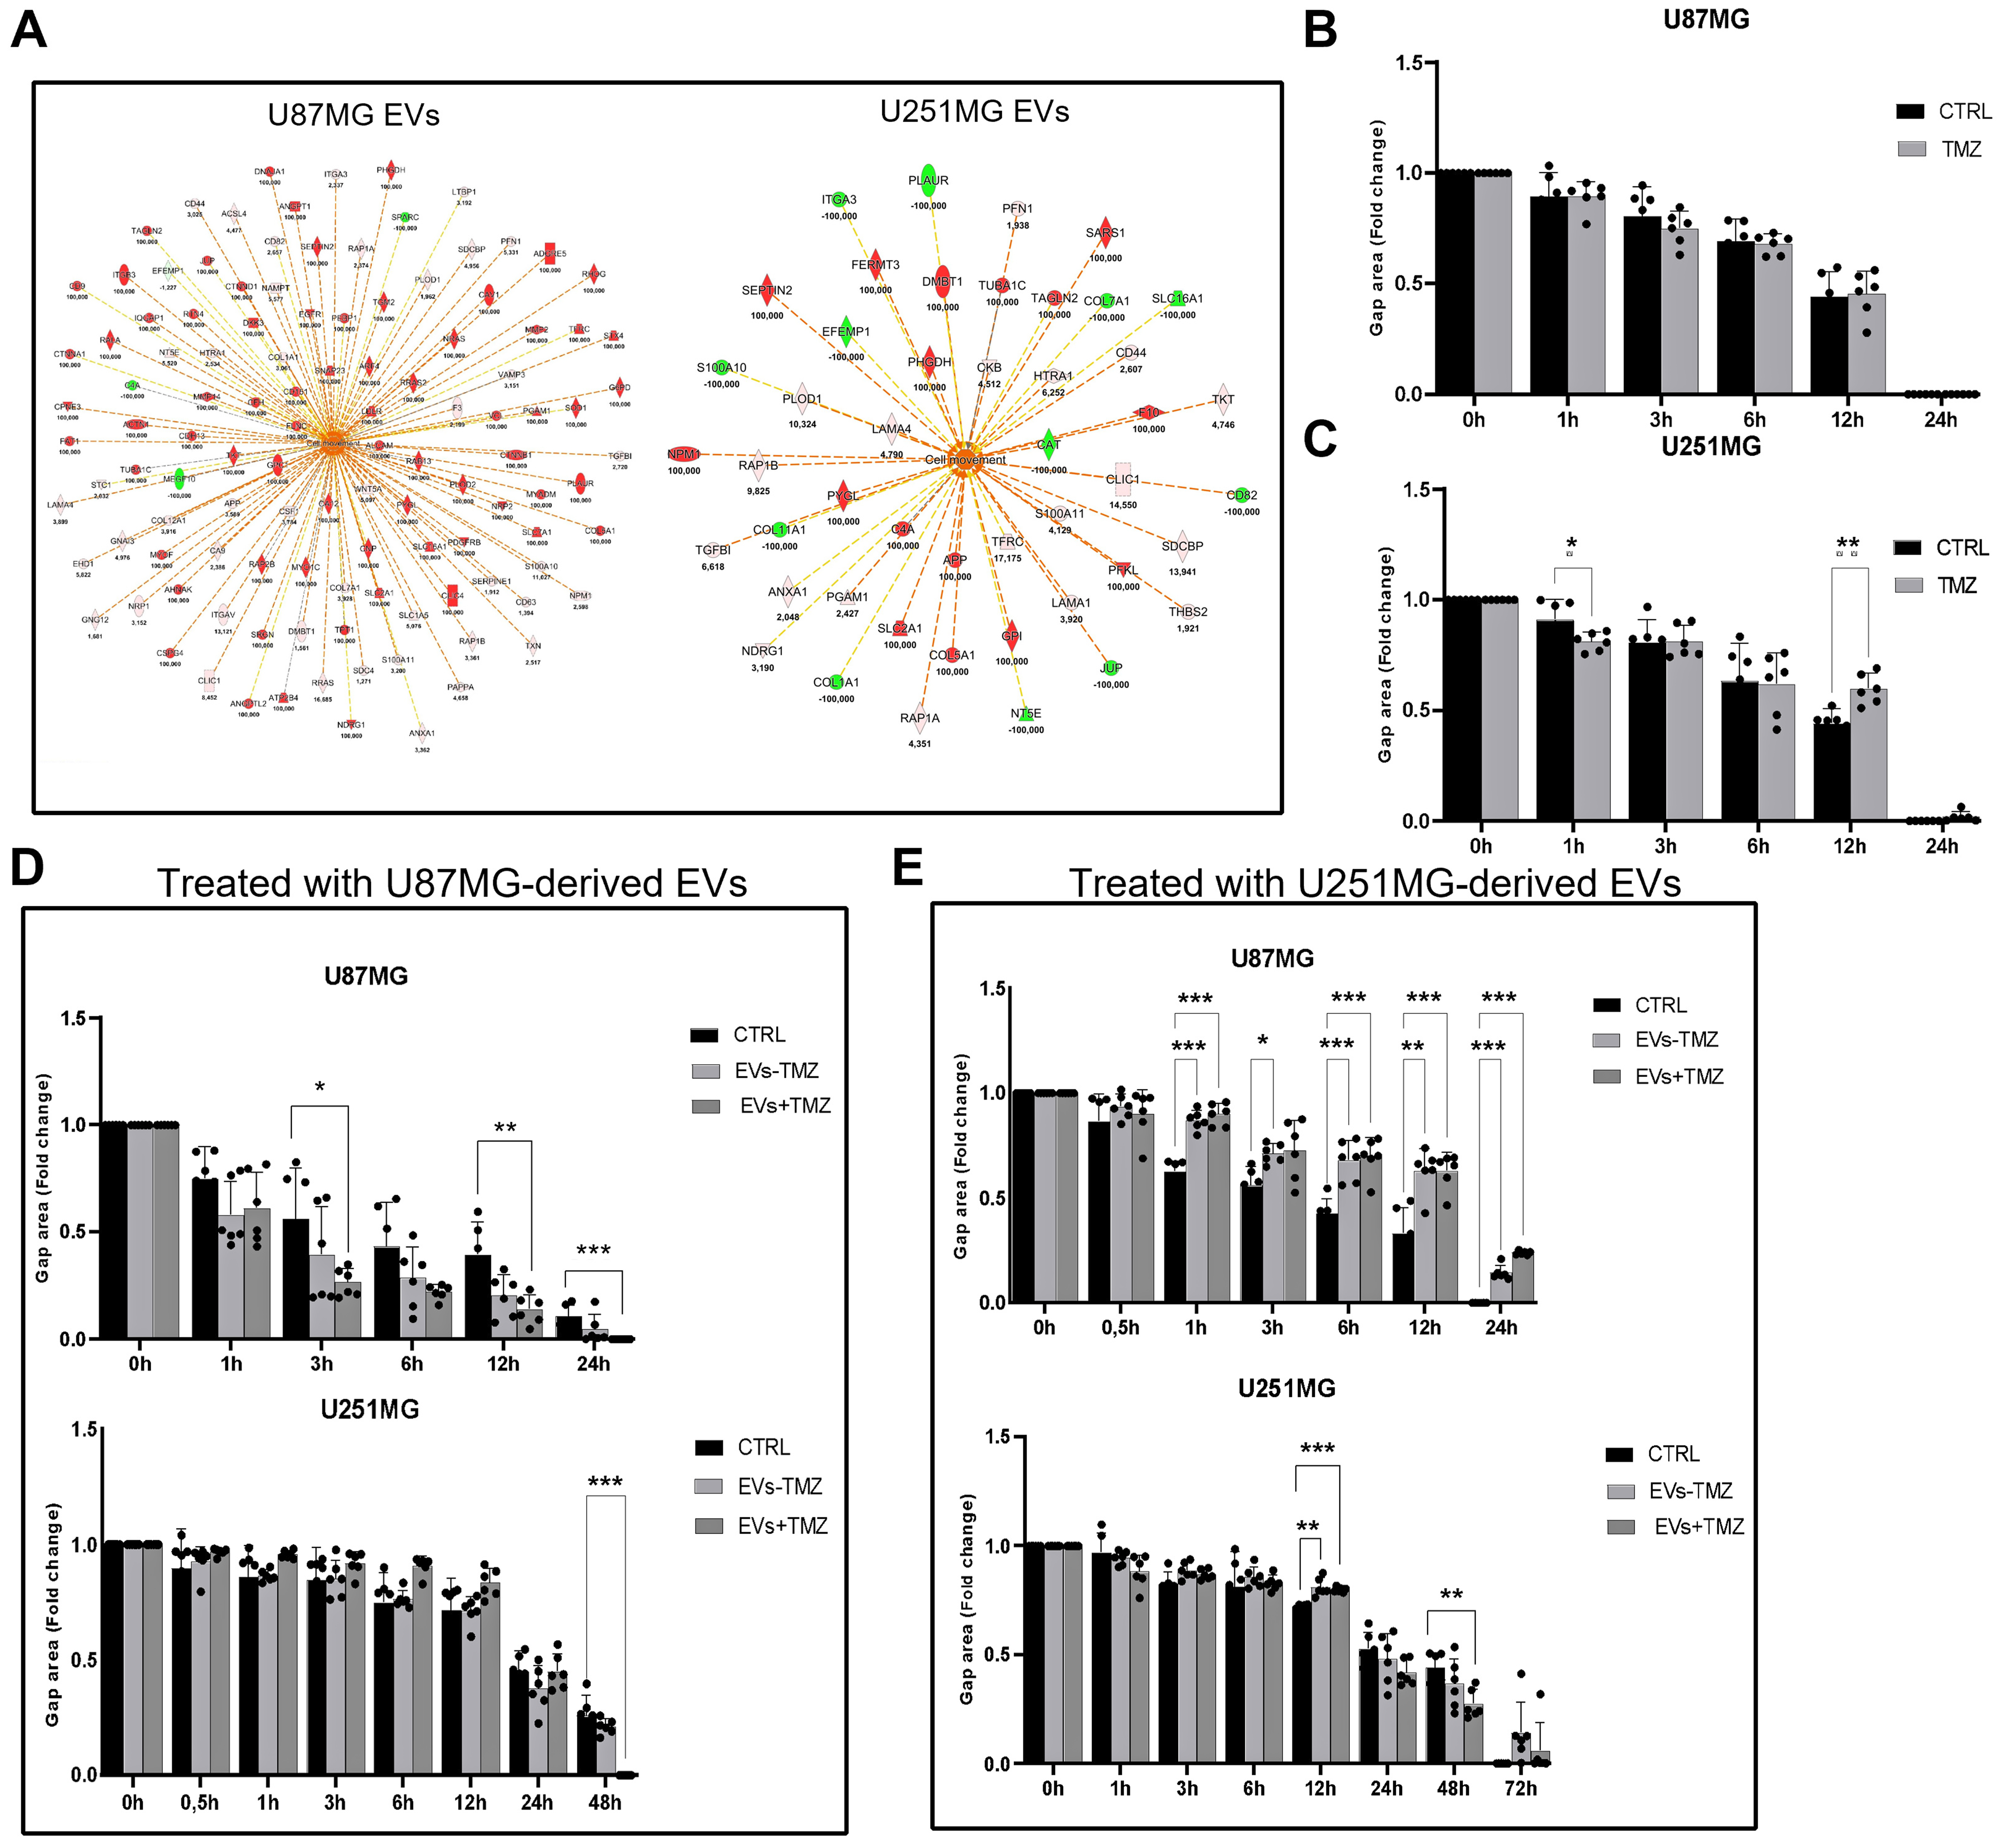
Figure 4. The effect of TMZ treatment on GBM-derived EVs and the migratory activity of TMZ-treated and EV-treated recipient GBM cells. (A) Downstream effect analysis of EV protein datasets revealed the predicted activation of the “Cell Movement” biofunction. Orange and blue shapes represent predicted activation or inhibition, respectively. Instead, red and green shapes represent increased or decreased EV-quantified protein measurements, respectively, with expression values reported in the figure (ratio: EVs +TMZ/EVs -TMZ). Continuous lines represent direct relationships, dotted lines represent indirect relationships, whereas grey and yellow lines indicate the non-predicted and inconsistent relationships. Quantitative data graph of wound healing assay in untreated and TMZ-treated U87MG (B) and U251MG (C) cells measured at 0, 1, 3, 6, 12, and 24 h. The gap area at 0 h was set to 1, and the gap area at 1, 3, 6, 12, and 24 h was calculated as a fold change relative to that. Data are presented as mean ± SD of three independent biological replicates (n = 3). *P < 0.05, **P < 0.01, ***P < 0.001 vs. control (Student’s t-test); Quantitative data of wound healing assay of U87MG and U251MG cells treated with EVs from untreated (EVs -TMZ) and TMZ-treated (EVs +TMZ) U87MG (D) and U251MG (E) cells measured at 0, 1, 3, 6, 12, and 24 h for both cell lines, and additionally at 48 and 72 h for U251MG cells. The gap area at 0 h was normalized to 1 for each experimental group, and gap areas at later time points, until gap closure, were expressed as a fold change relative to 0 h. Data are presented as mean ± SD of three independent biological replicates (n = 3). *P < 0.05, **P < 0.01, ***P < 0.001 vs. control (Student’s t-test). Representative bright-field images of the scratch are shown in Supplementary Figure 4. EVs: Extracellular vesicles; GBM: glioblastoma; SD: standard deviation; TMZ: temozolomide.