





fig3
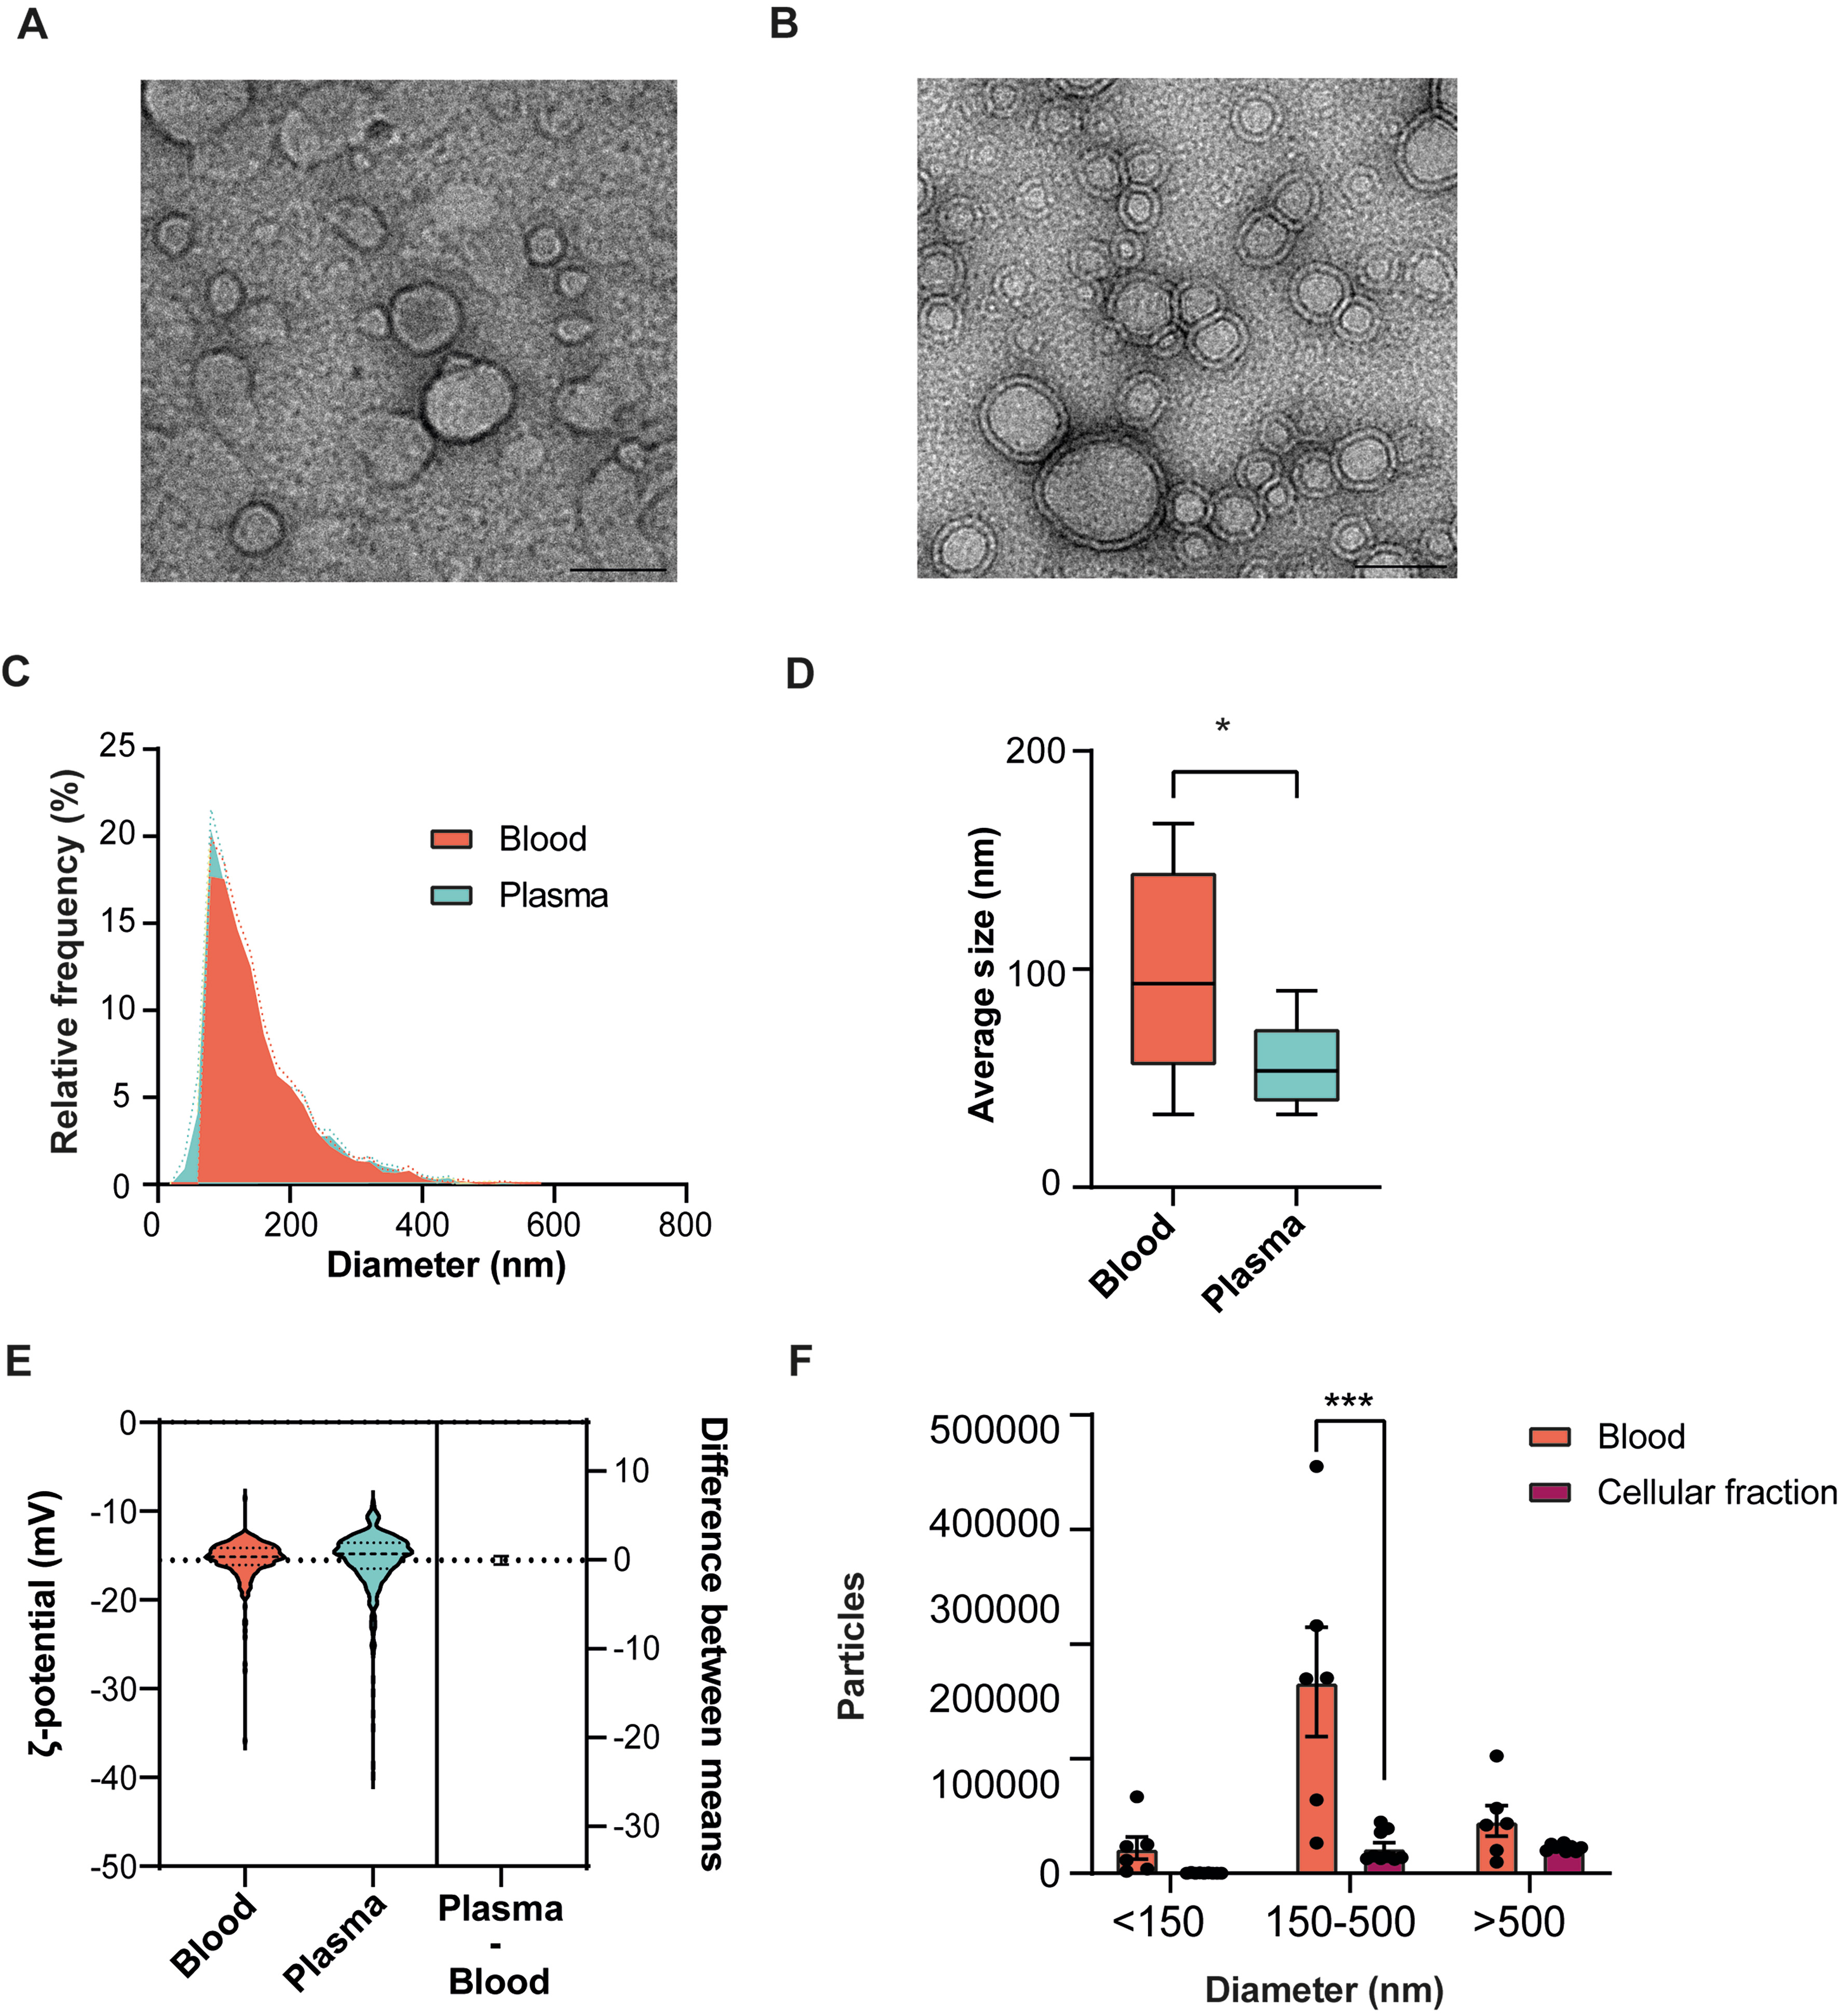
Figure 3. Morphological characterization of PROSPR-enriched EVs from blood, plasma, and from the plasma-depleted blood fraction (cellular fraction) obtained after plasma separation. (A) Representative TEM micrograph of EVs enriched from blood; (B) Representative TEM micrograph of EVs enriched from plasma. Scale bars represent 100 nm in all TEM panels; (C) Histogram of the relative frequency of EV diameters measured by TRPS in blood (red) and plasma (blue). Discontinuous lines indicate the SEM; (D) Quantitative size distribution (mean diameter) of EVs from blood and plasma measured by TRPS; (E) Estimation plot comparing the ζ-potential between blood and plasma measured by TRPS; (F) Quantitative comparison of EV particle count size distribution from blood (red) and cellular fraction (dark red) measured by dFC. Particle counts are represented by size categories: < 150 nm, 150-500 nm, and > 500 nm. Statistical significance was evaluated using an unpaired t-test and considered at P < 0.05, represented as follows: *P ≤ 0.05; ***P ≤ 0.001; ns indicates no significant difference. Analyses were performed using independent biological samples (n = 3 per condition), each with three technical replicates. PROSPR: PRotein Organic Solvent PRecipitation; TEM: transmission electron microscopy; EVs: extracellular vesicles; TRPS: tunable resistive pulse sensing; SEM: standard error of the mean; dFC: dedicated flow cytometry.




