





fig2
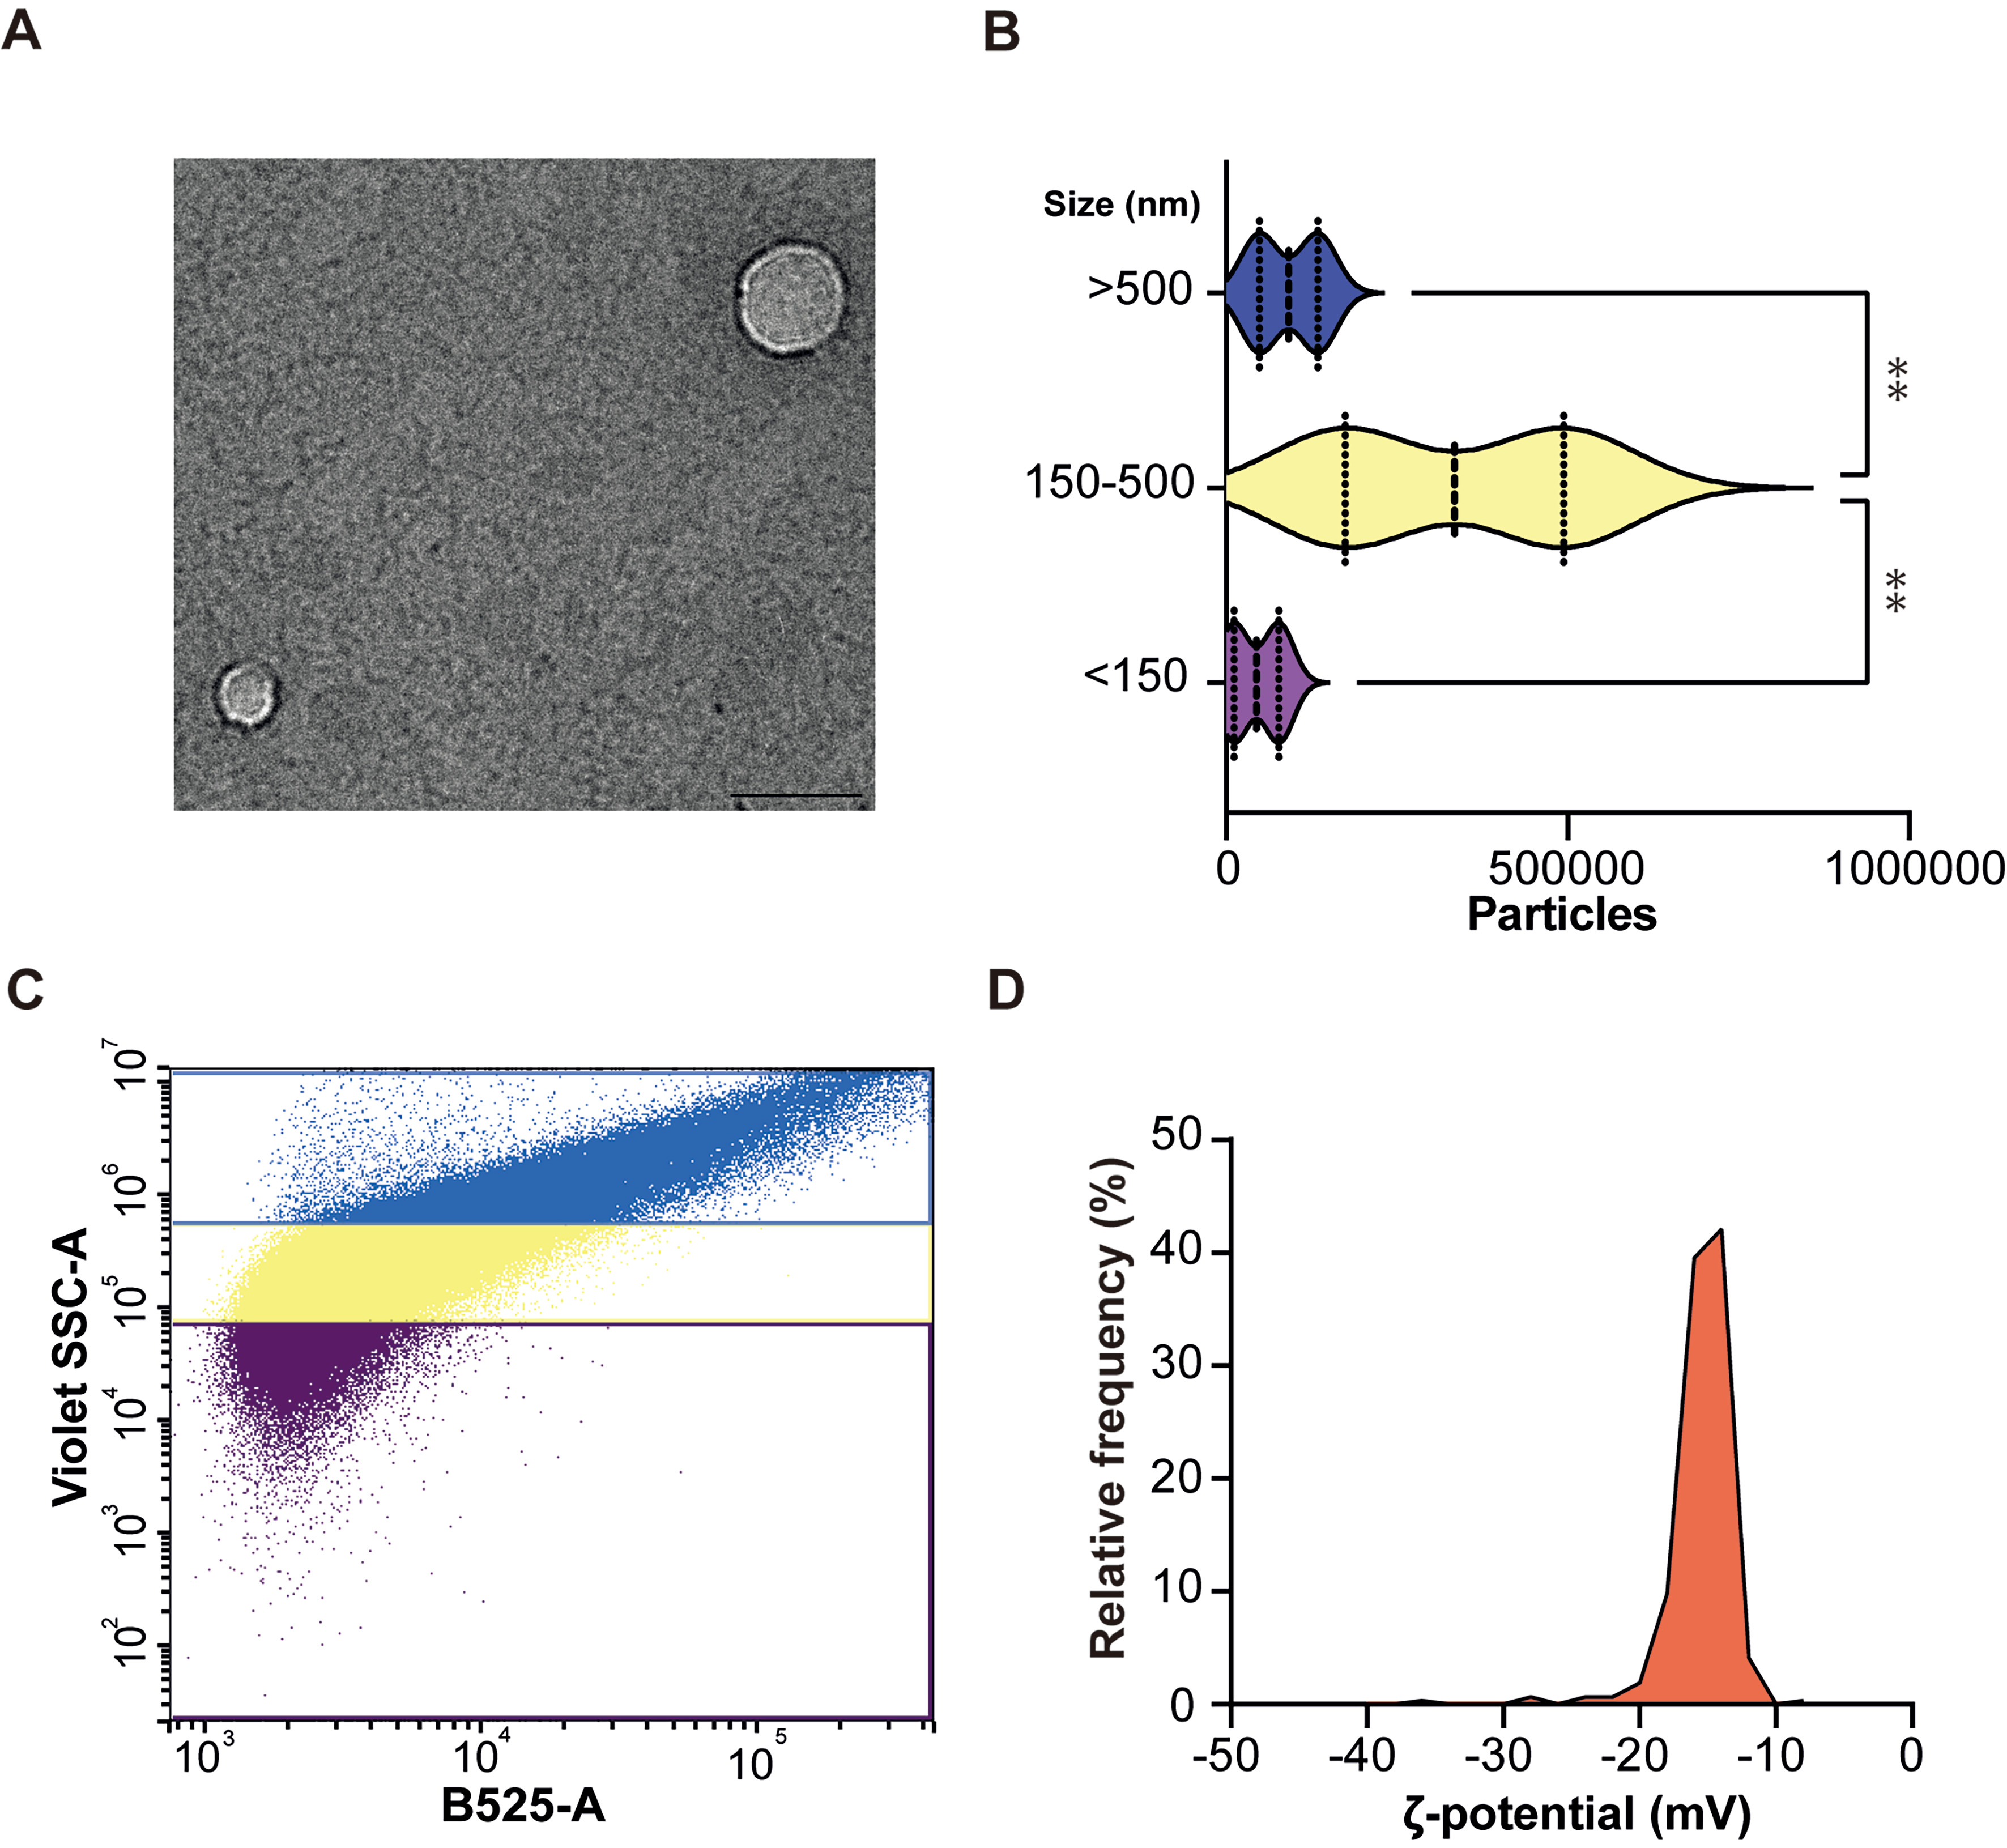
Figure 2. Morphological and physicochemical characterization of EVs isolated from blood using the optimized PROSPR protocol. (A) Representative TEM image of EVs isolated from blood using the PROSPR protocol. Scale bars: 100 nm; (B) Characterization of EV particles by dFC. Particle counts are shown by size categories: < 150 nm (purple), 150-500 nm (yellow), and > 500 nm (blue); (C) Quantitative size distribution of blood-derived EVs measured by dFC; (D) Electrophoretic Zeta potential (ζ-potential) distribution of blood-derived EVs measured by TRPS. The histogram shows the relative frequency of particles as a function of ζ-potential (mV). Data represent a single homogeneous population with a mean ζ-potential of -15.3 ± 1.8 mV. Statistical significance was defined as P < 0.05. Asterisks denote levels of significance (**P ≤ 0.01). Statistical differences were assessed by one-way ANOVA. EVs: Extracellular vesicles; TEM: transmission electron microscopy; dFC: dedicated flow cytometry; TRPS: tunable resistive pulse sensing; PROSPR: PRotein Organic Solvent PRecipitation; ANOVA: analysis of variance.




