





fig3
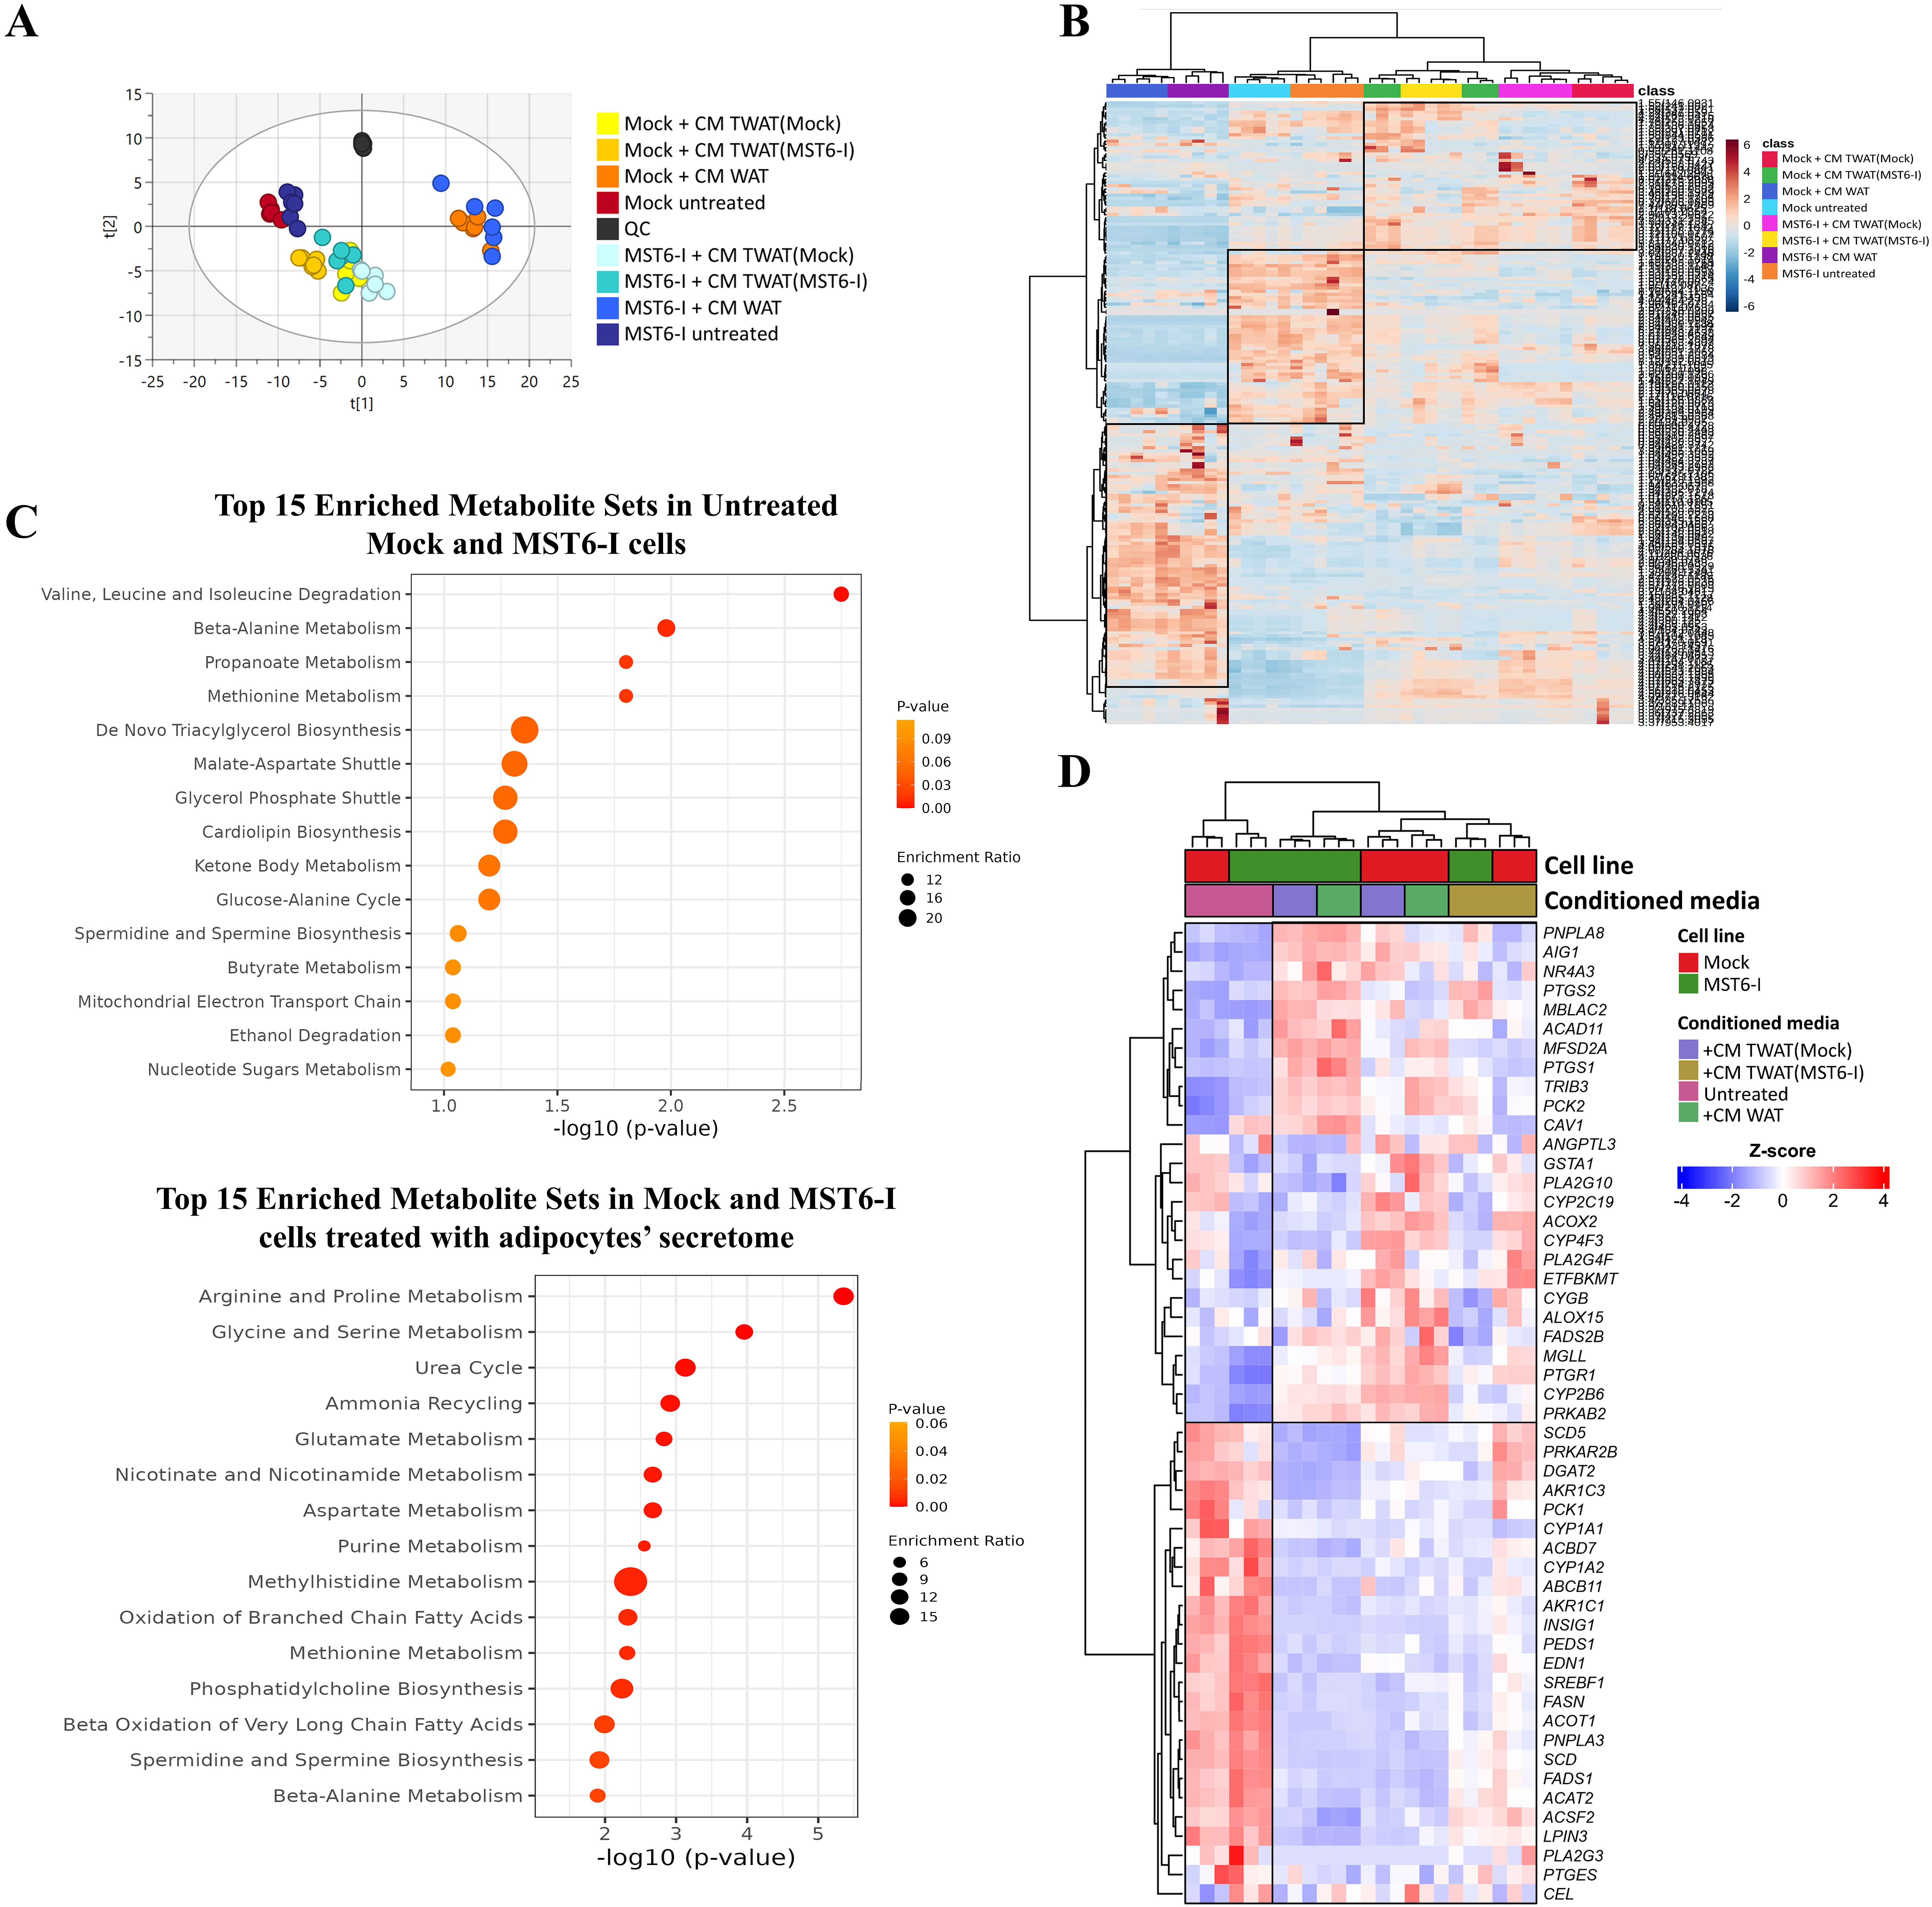
Figure 3. Adipocyte-derived secretome reprograms gastric cancer cell metabolism. (A) PCA scores plot of Mock and MST6-I cells (R2X[1] = 0.339, R2X[2] = 0.136, 2 PCs and Pareto scaling), untreated or treated with the secretome/CM from white or TWAT(Mock) and TWAT(MST6-I) adipocytes; (B) Hierarchical clustering of the metabolomic profiles of Mock and MST6-I cells, untreated or treated with the secretome/CM from white or TWAT(Mock) or TWAT(MST6-I) adipocytes; (C) Pathway analysis of the top 15 enriched metabolite sets identified as upregulated in untreated Mock and MST6-I cells (upper panel) or after exposure to secretome/CM from white or TWAT(Mock) and TWAT(MST6-I) adipocytes (lower panel); (D) Heatmap representation of transcriptomic profiles of Mock and MST6-I cells, either untreated or treated with secretome/CM from white or TWAT(Mock) and TWAT(MST6-I) adipocytes, related to fatty acid metabolic processes. CM: Conditioned medium. PCA: principal component analysis; PC: principal component.




