


fig5
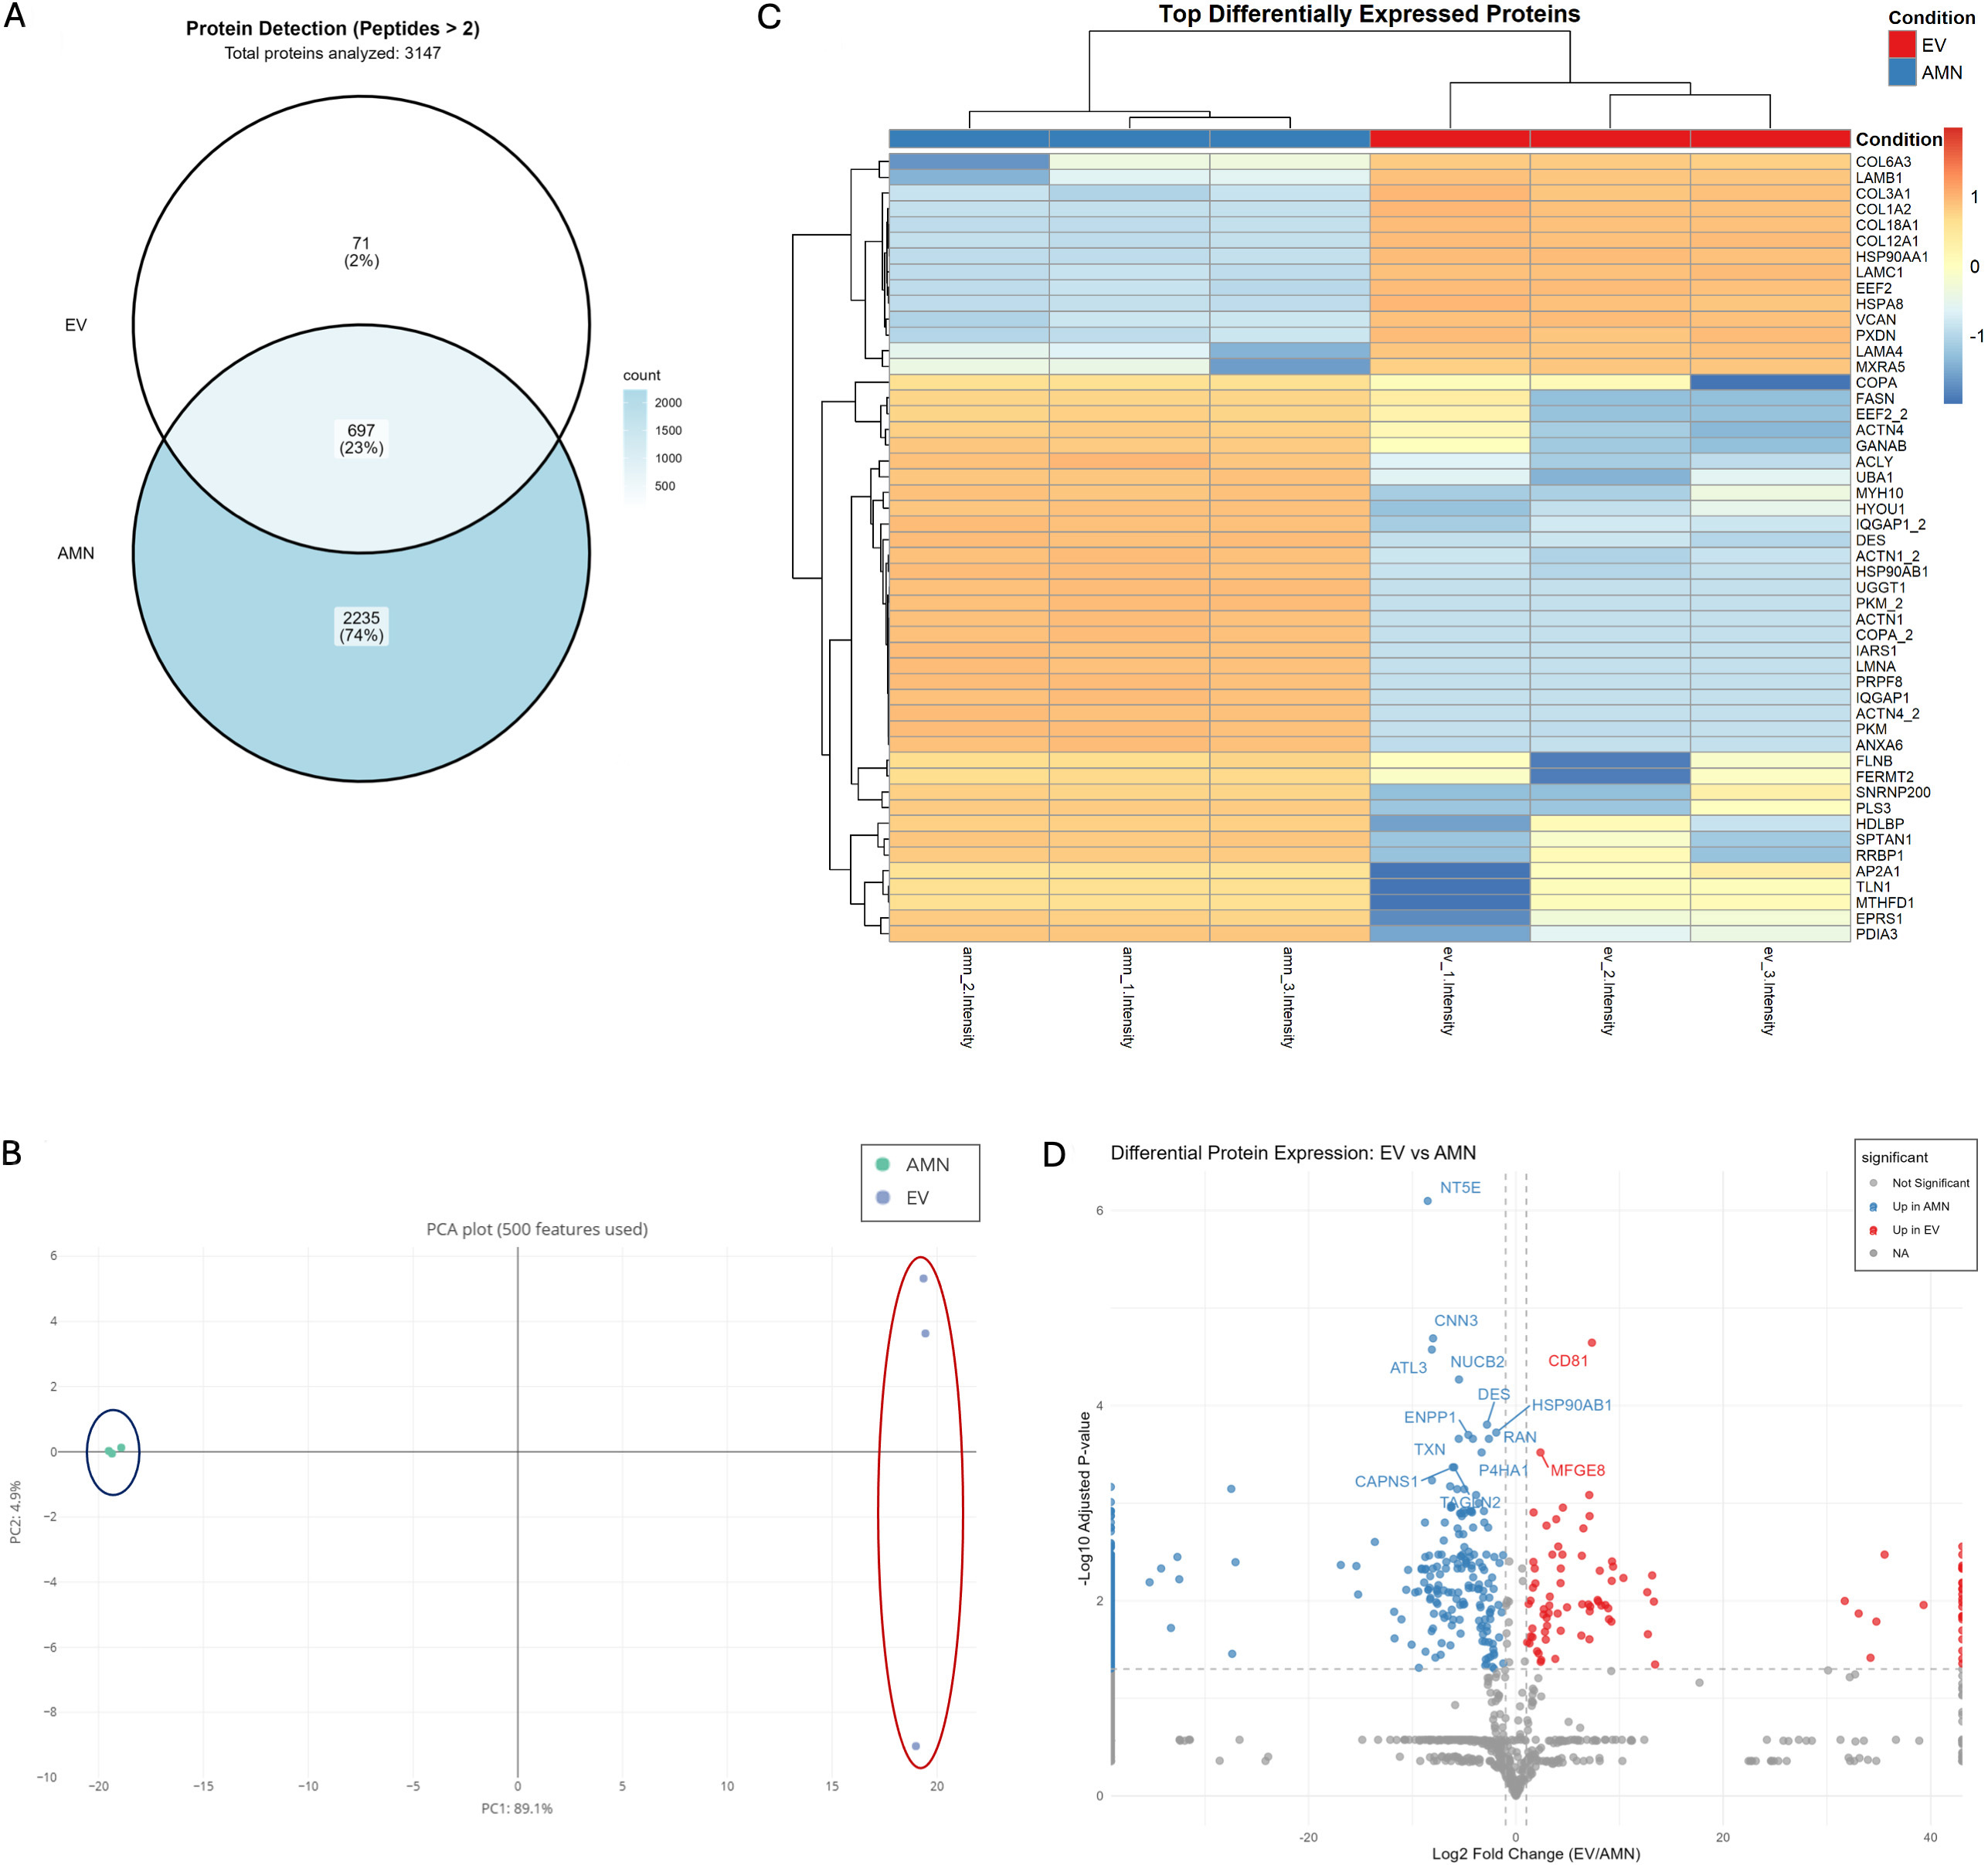
Figure 5. Protein expression characterization of eAMCs and EVs. (A) Venn diagram representing the proteins exclusively expressed by eAMCs (2,235 proteins, 74%), EVs (71 proteins, 2%), and those commonly detected in both eAMCs and EVs (697 proteins, 23%). Total proteins with quantifiable intensity: 3,003. Of 3,147 proteins identified with ≥ 2 peptides, 144 proteins lacking detectable intensity in both groups were excluded from the Venn diagram; (B) Principal Component Analysis (PCA) of eAMCs and EVs based on 500 protein features, demonstrating distinct clustering of the samples. PC1 (69.1% variance) and PC2 (4.0% variance) separate eAMCs (blue ellipse) from EVs (red ellipse), indicating substantial proteomic differences between parental cells and their derived vesicles; (C) Heatmap visualization of the top differentially expressed proteins between eAMCs and EVs. Clustering method: Unsupervised hierarchical clustering was performed using Euclidean distance with complete linkage on both rows (proteins) and columns (samples). Each row represents an individual protein, and each column represents a biological replicate (n = 3 per group). Color scale: The heatmap displays Z-score normalized protein abundances, where blue indicates lower relative expression and orange/red indicates higher relative expression. Z-scores represent the number of standard deviations from the mean abundance of each protein across all samples. The dendrogram on the left shows protein clustering relationships; (D) Volcano plot of differentially expressed proteins between EVs and eAMCs. The x-axis shows log2 fold change (EV/AMN), while the y-axis shows -log10 adjusted P-values. Red dots indicate proteins significantly enriched in EVs (up in EV), blue dots indicate proteins enriched in eAMCs (up in AMN), and grey dots represent proteins without significant differential expression. Significance thresholds: adjusted P-value < 0.05 and |log2 fold change| ≥ 1. Selected protein names are labelled for key differentially expressed proteins. eAMCs: Equine amniotic mesenchymal cells; EVs: extracellular vesicles; EV: extracellular vesicle; AMN: amniotic mesenchymal cells; NA: not applicable.


