


fig4
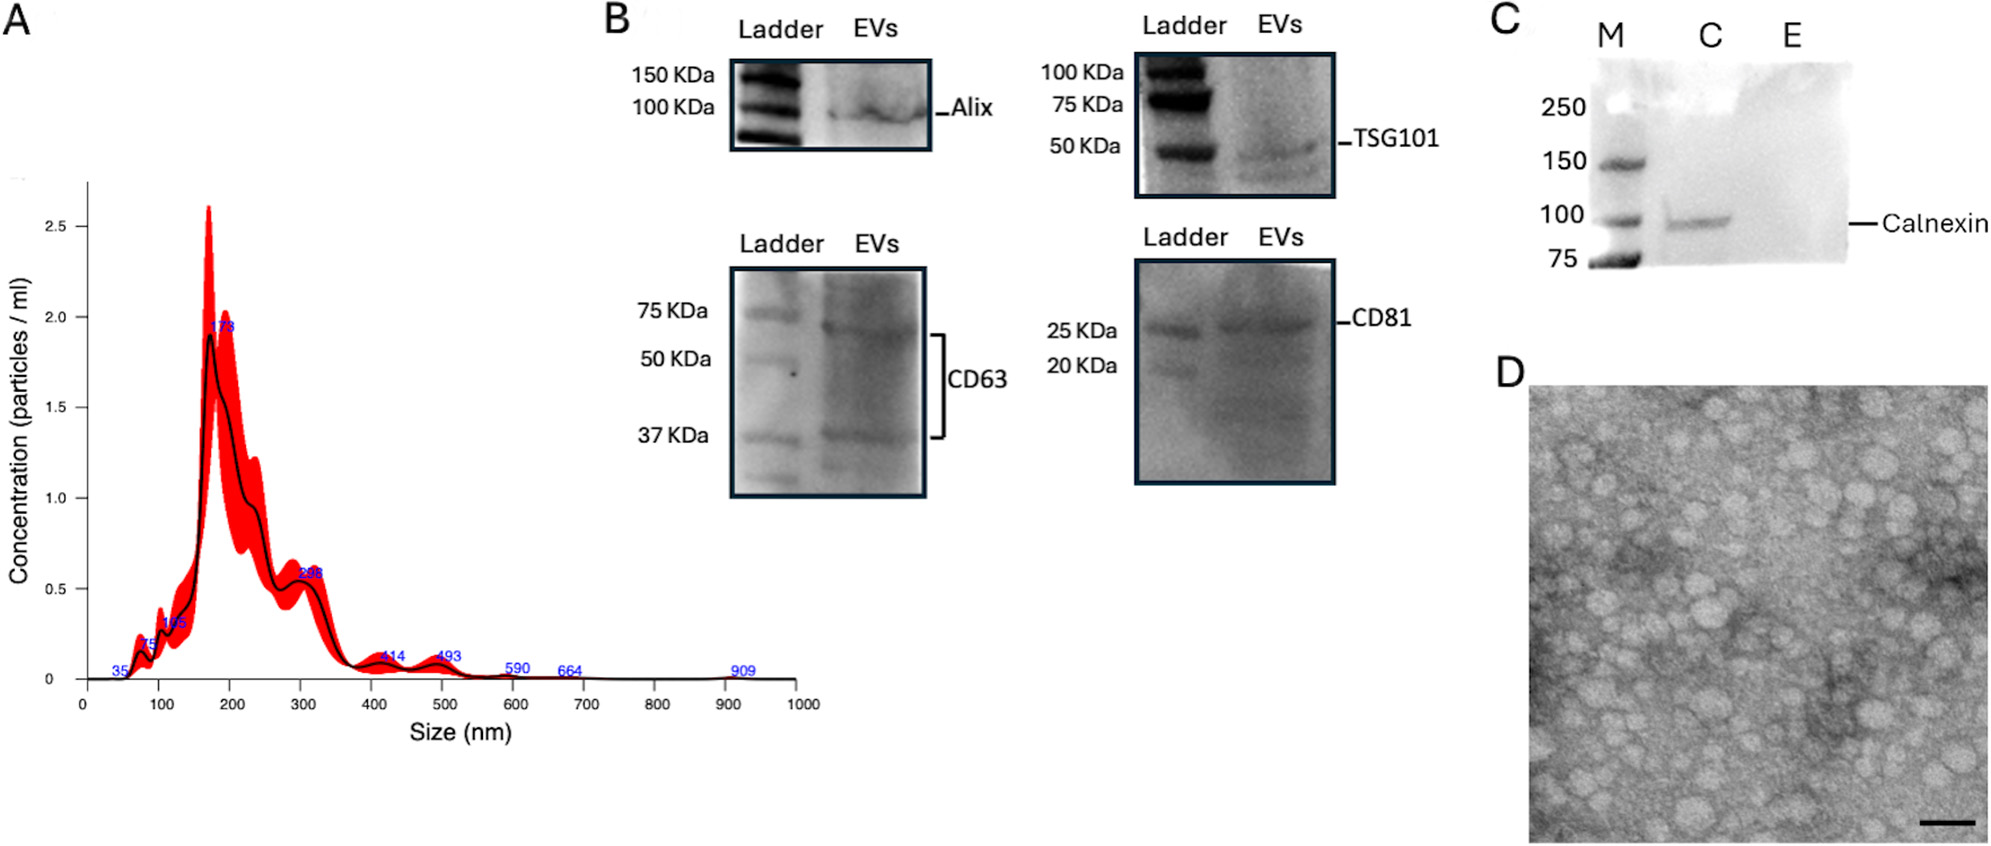
Figure 4. EV characterization. (A) NanoSight analysis for AMC-EV dimensions and concentrations; (B) Western blot analysis for internal marker Alix and TSG101 and surface markers CD63 and CD81, specific for EVs; (C) Comparative Western blot between AMC and EV samples for calnexin detection, typical marker for cell lysates. Legend: M = marker, C = AMC sample, E = EV sample; (D) Transmission electron microscopy image of AMC-EVs. Scale bar: 200 nm. EV: Extracellular vesicle; EVs: extracellular vesicles; AMC: amniotic-derived mesenchymal stromal cells; TSG101: tumor susceptibility gene 101.


