

fig7
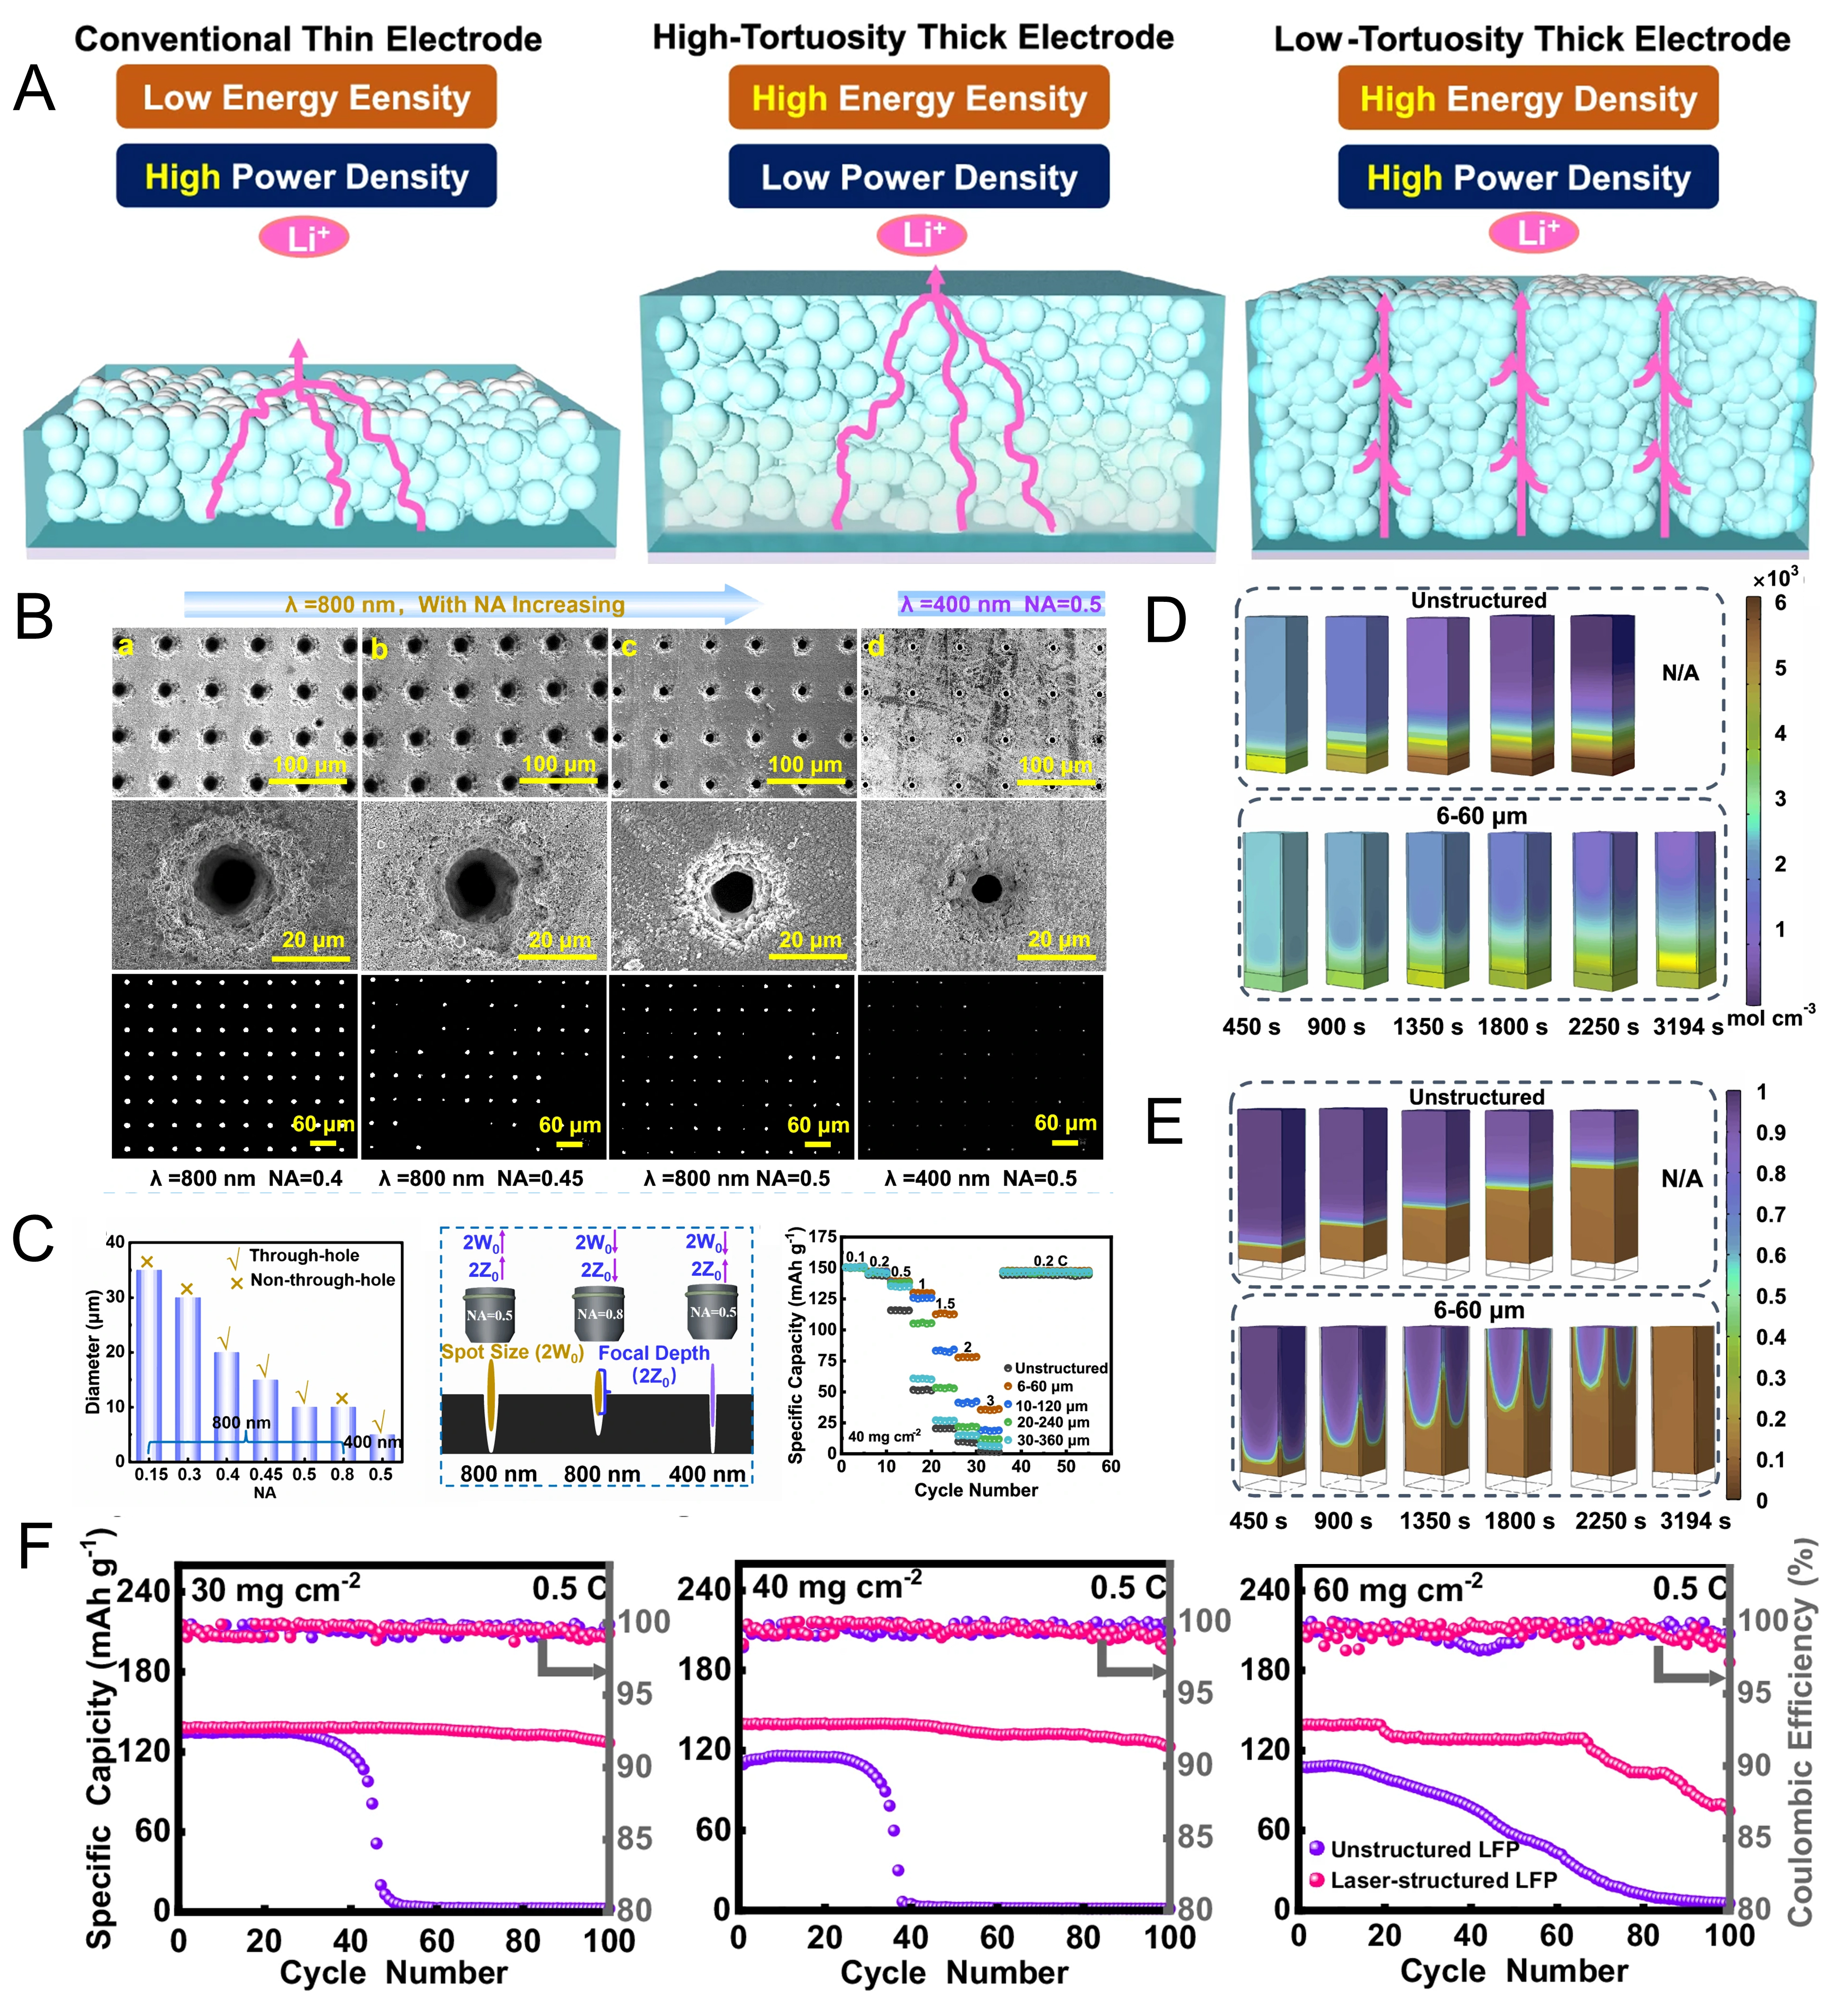
Figure 7. (A) Schematic illustration of conventional thin, high-tortuosity thick, and low-tortuosity thick electrodes; (B) SEM and backlight microscopy images showing micro-hole arrays created by femtosecond laser percussion drilling using objective lenses with different numerical apertures (NA = 0.4, 0.45, and 0.5) and different wavelengths (800 and 400 nm); (C) relationship between aperture size, NA, and wavelength (left), effects of NA and wavelength on the diameter and aspect ratio of laser-drilled holes (middle), and influence of hole size/distribution on rate capability for 6-60, 10-120, 20-240, and 30-360 μm configurations (right); (D) electrolyte salt concentration distribution; (E) electrode state-of-charge evolution over time for unstructured LFP and 6-60 μm structured LFP during 1C discharge; (F) cycling performance at 0.5C for different mass loadings (30, 40, and 60 mg cm-2); (A-F) are reprinted with permission from Ref.[98], under CC BY NC-ND license. SEM: Scanning electron microscopy; NA: numerical aperture.