


fig6
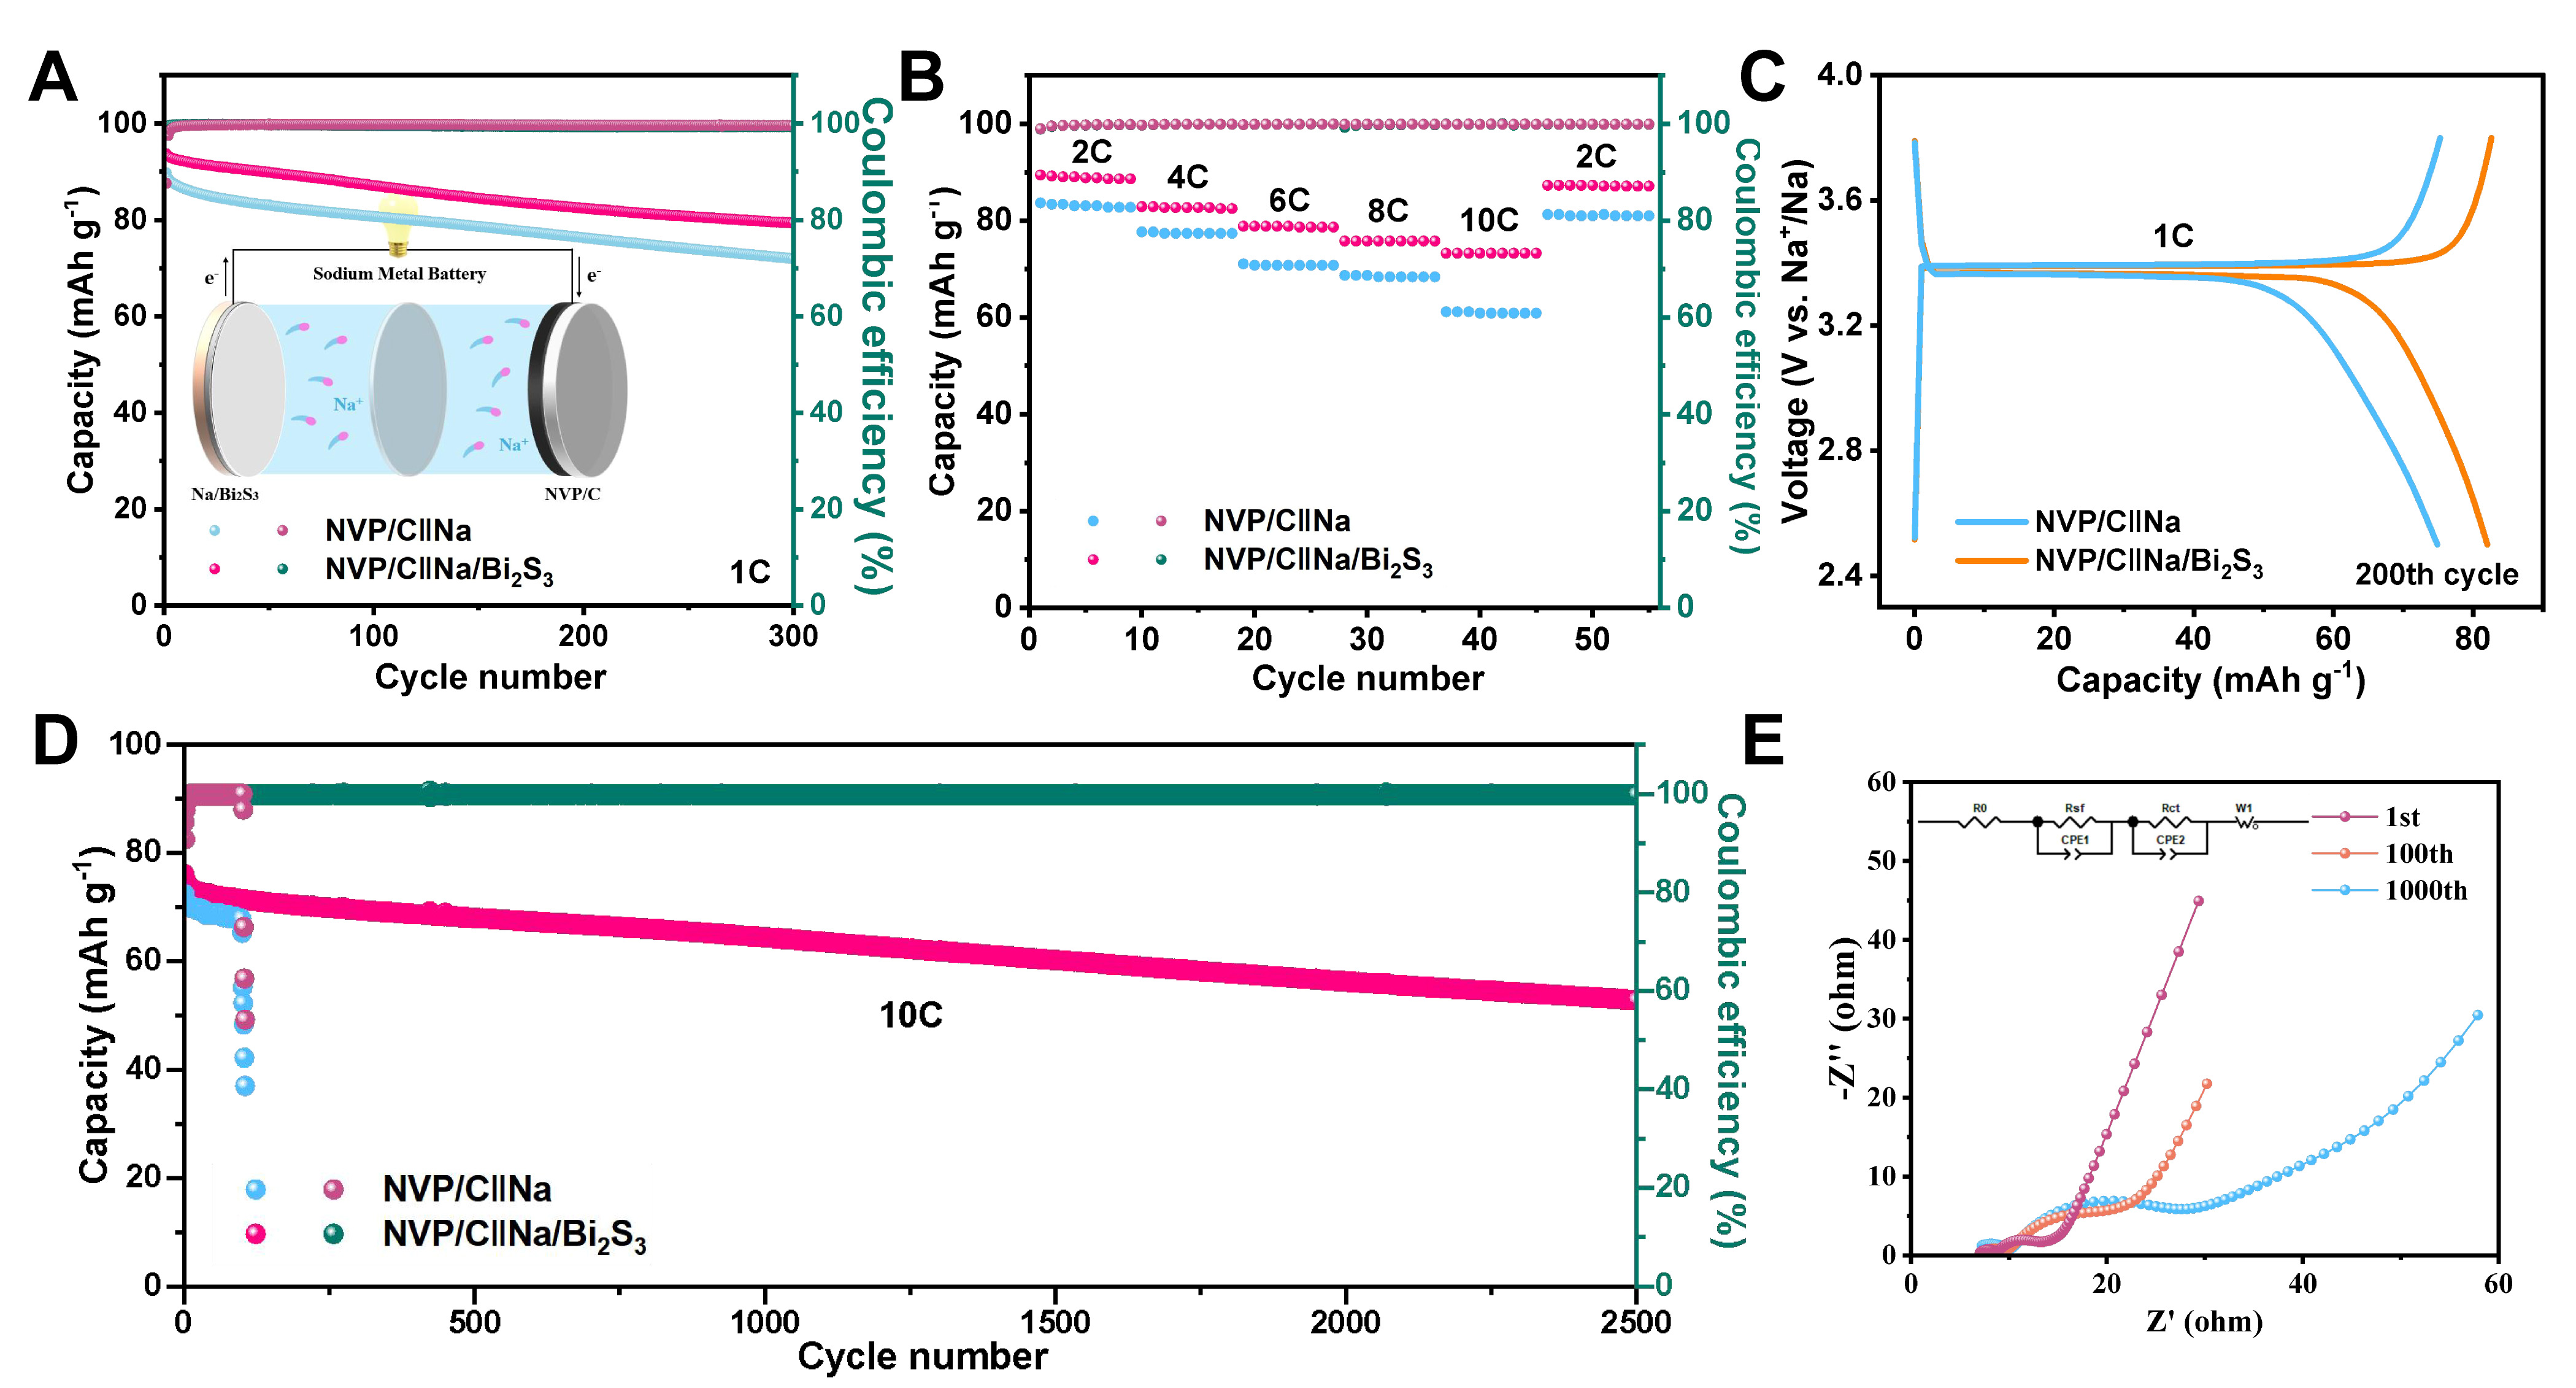
Figure 6. (A) Cycling performances at 1 C, (B) rate performances at different rates, (C) GCD profiles at 1 C, and (D) high-rate cycling performances at 10 C for the the NVP/C‖Na/Bi2S3 and NVP/C‖Na full cells; (E) Nyquist plots of the NVP/C‖Na/Bi2S3 full cells after different cycles with inset showing the corresponding equivalent circuit diagram. GCD: Galvanostatic discharge; NVP/C: Na3V2(PO4)3/C.


