


fig5
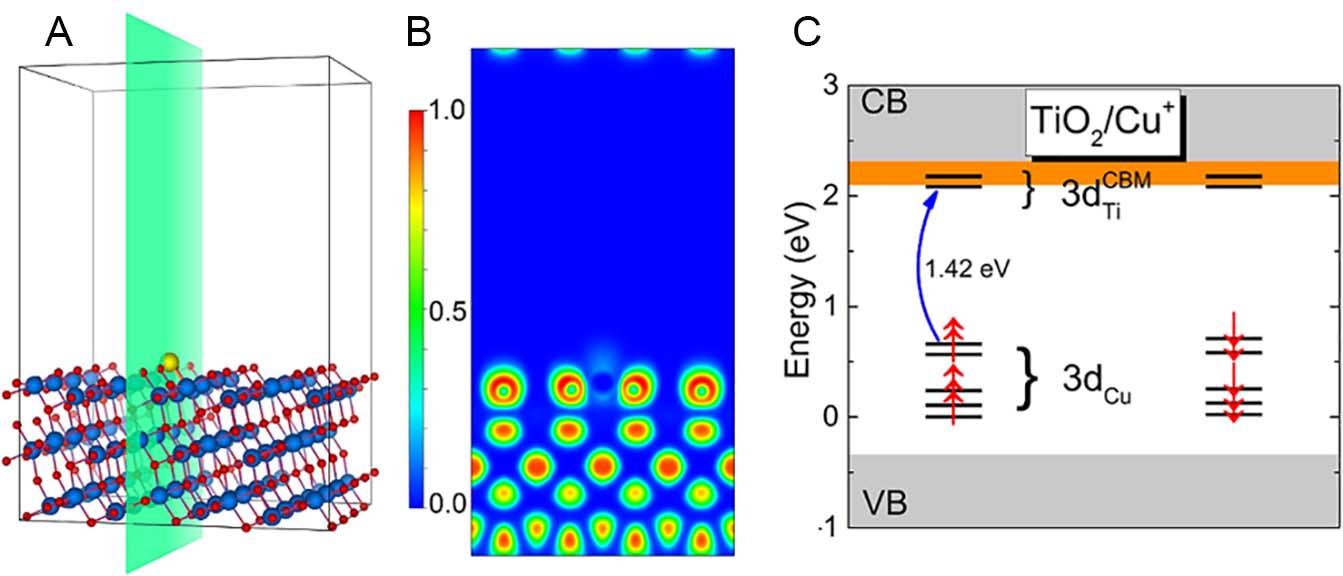
Figure 5. (A) Supercell of anatase TiO2(101) with an adsorbed Cu atom. Yellow, blue, and red spheres represent Cu, Ti, and O atoms, respectively. The electron localization function (ELF) is shown in green, (B) its projection on the (100) plane. (C) The Kohn-Sham eigenvalue spectrum with Cu⁺ 3d levels near the TiO2 bandgap; the gray and orange areas represent the TiO2 valence/conduction bands and the perturbed CBM, respectively. The blue arrow indicates a d-d transition between the localized Cu⁺ 3d state and the perturbed CBM. (A-C) is reproduced from ref.[64] under the CC BY 4.0 license.


