


fig8
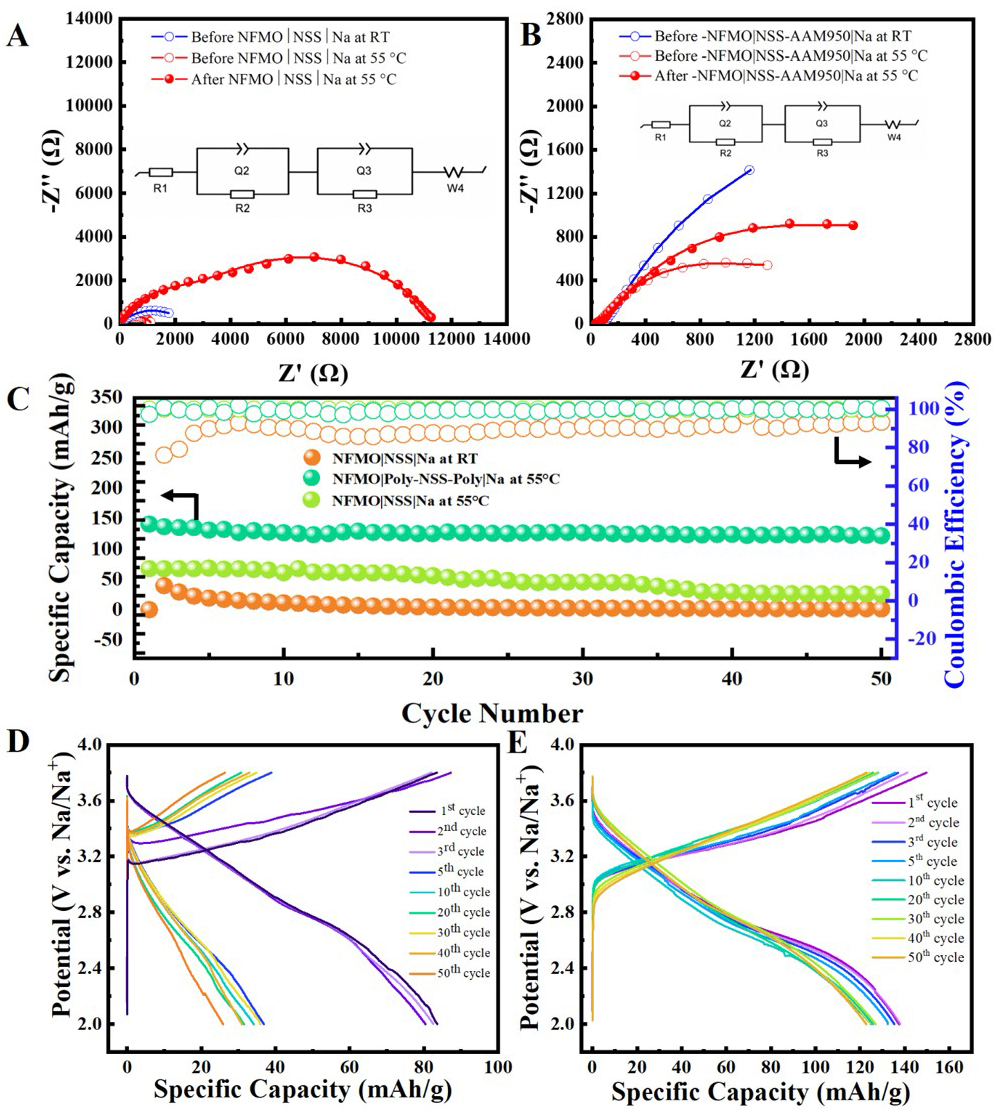
Figure 8. Nyquist impedance spectra before and after 50 electrochemical cycles of NFMO|SE|Na cells at 0.02 A g-1: (A) pristine NSS and (B) 7 µL AAM950-NSS-AAM950 at 55 °C (Inset: Equivalent circuit). (C) Cycling performance of NFMO|NSS|Na and NFMO|7 µL AAM950-NSS-AAM950|Na cells. (D and E) Corresponding galvanostatic charge/discharge profiles.


