


fig3
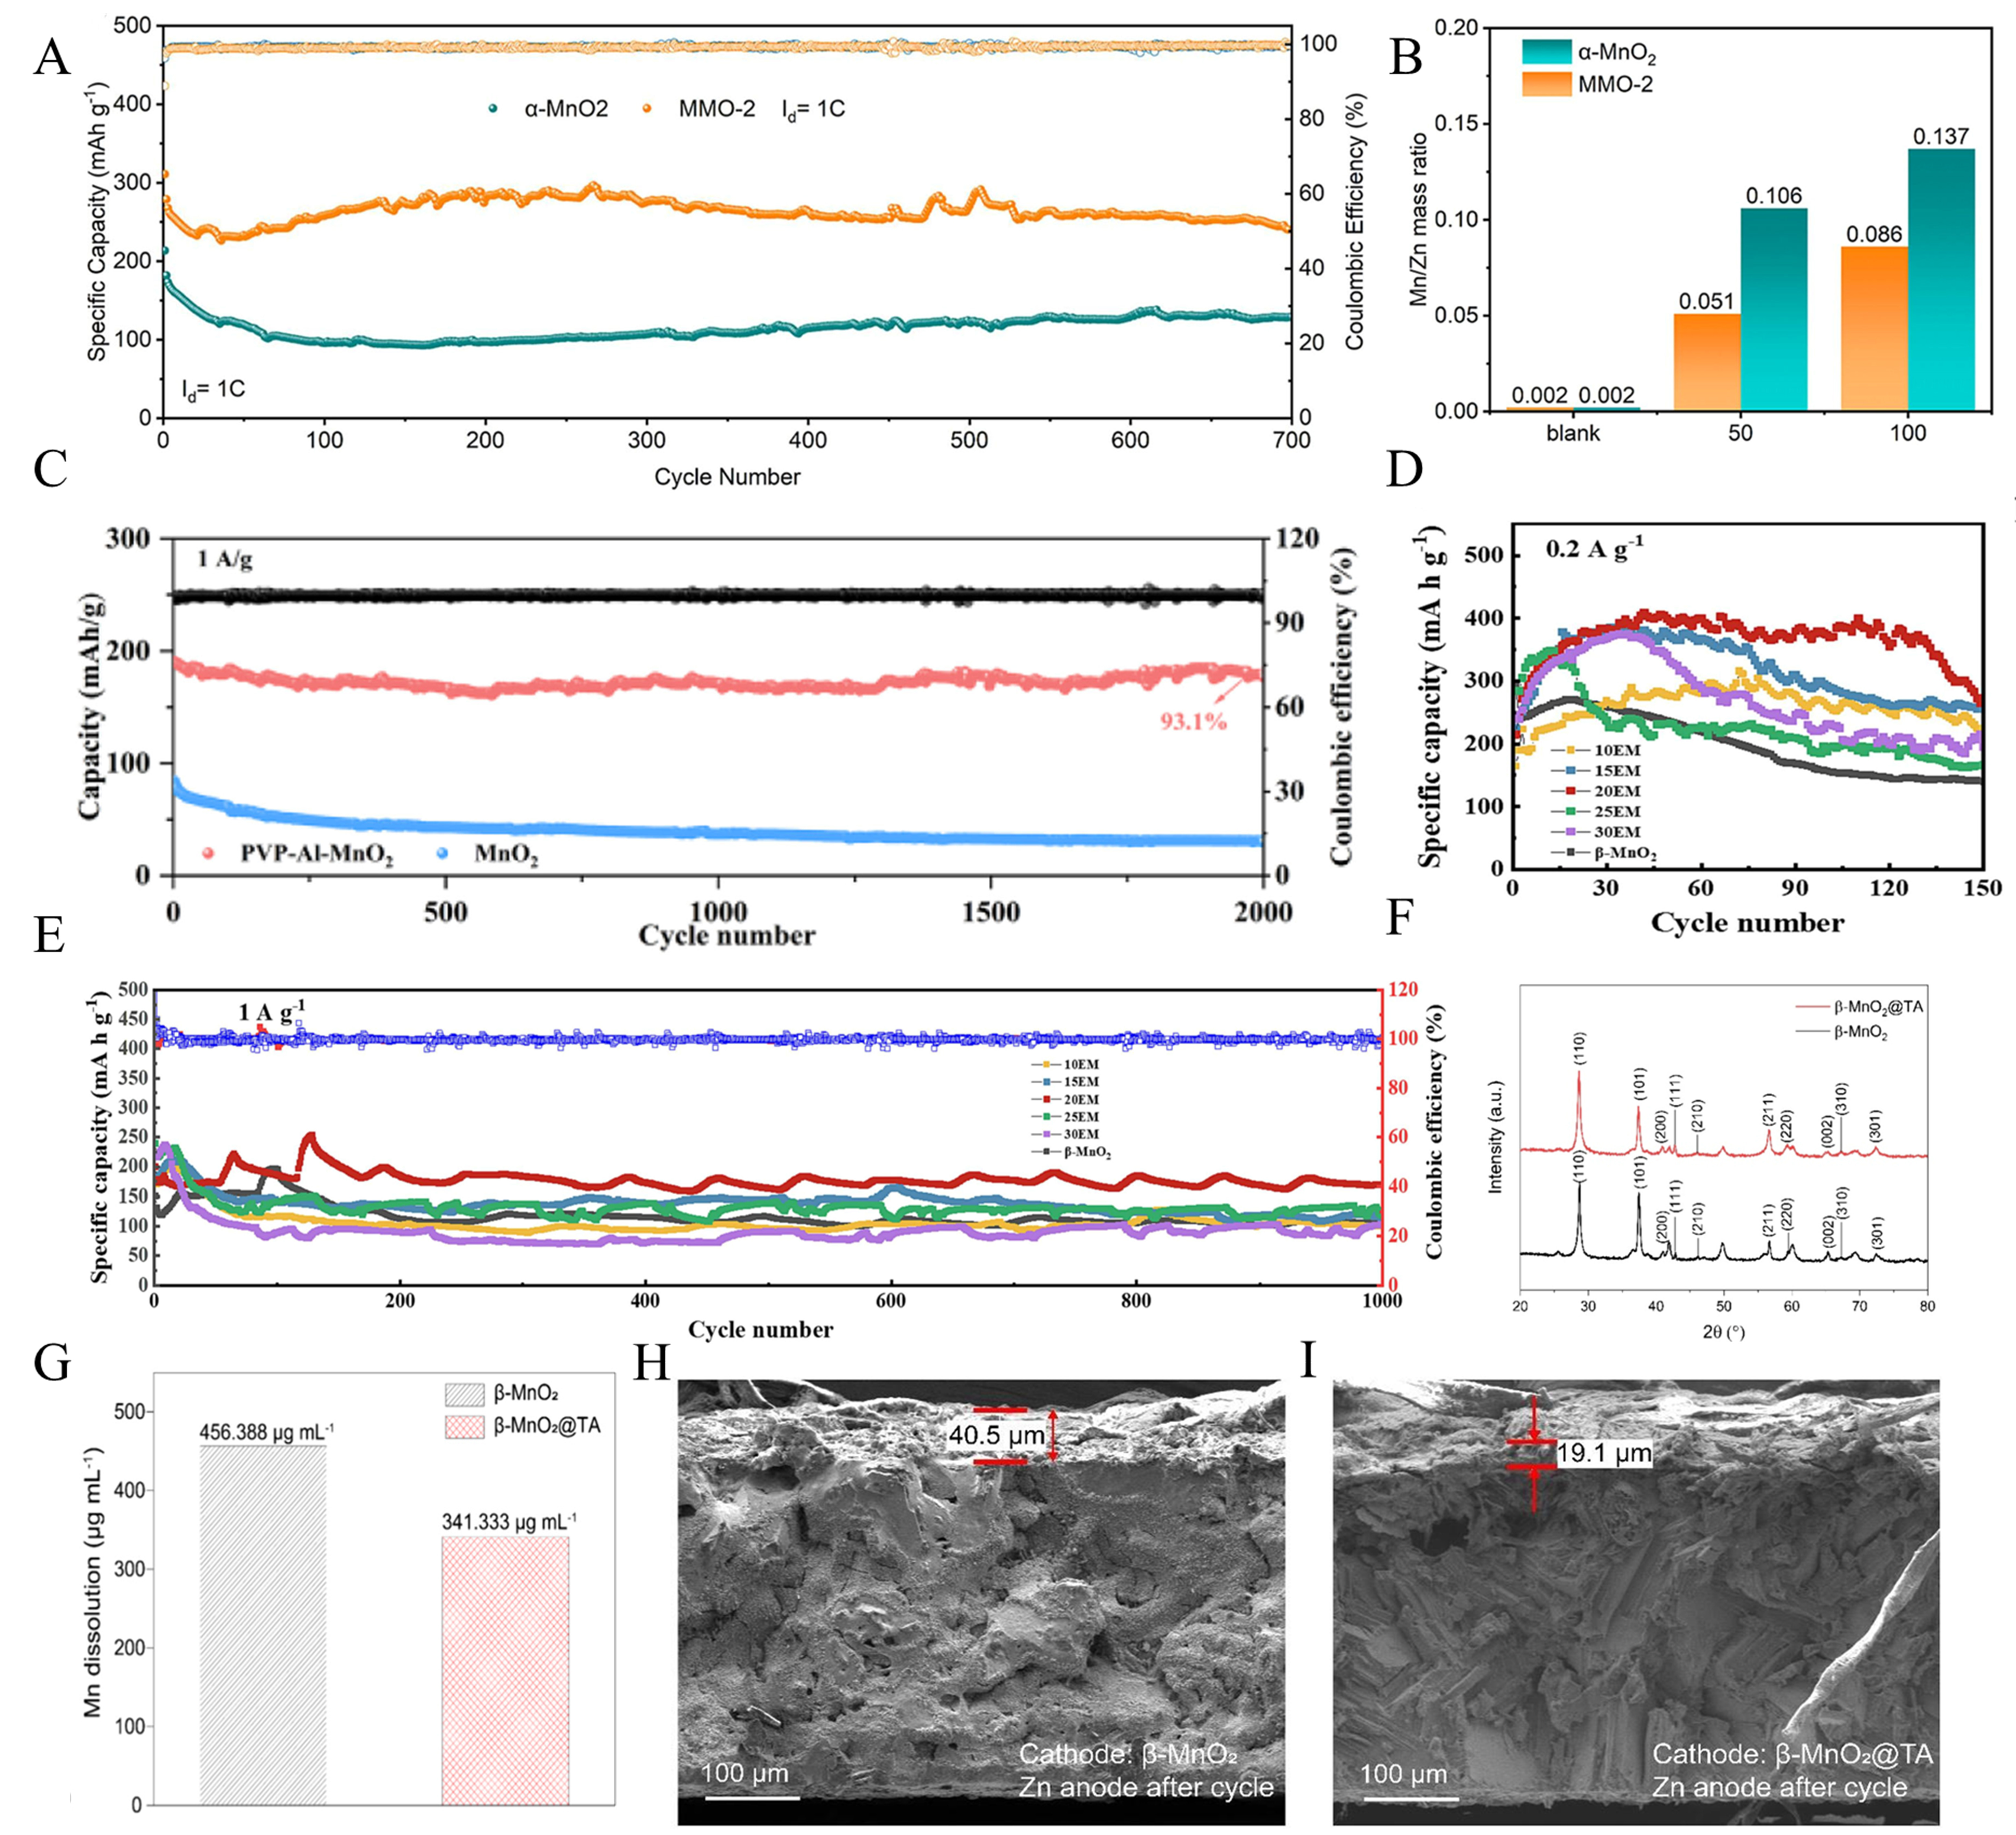
Figure 3. (A) Cycle Performance Comparison of Bare MnO2 and MMO-2 at 1C Rate. (B) Mn/Zn ratio in electrolyte for both bare MnO2 and MMO electrodes at different cycles. (A and B) Reprinted with permission from[80]. Copyright 2024, Elsevier; (C) Cycle performance of PVP-Al-MnO2 at 1.0 A g-1. Reprinted with permission from[83]. Copyright 2024, Elsevier; (D) Rate performance at different current densities. (E) Cycling performance at 1 A g-1 of β-MnO2 and Eu-doped MnO2 with different molar concentrations. (D and E) Reprinted with permission from[84]. Copyright 2023, Elsevier; (F) XRD patterns of synthesized β-MnO2 and β-MnO2@TA powder. (G) ICP analysis results comparing β-MnO2 and β-MnO2@TA after 100 cycles. (H-I) Cross-section SEM images of (H) Zn metal anode after 100 cycles using β-MnO2 as a cathode, (I) Zn metal anode after 100 cycles using β-MnO2@TA as a cathode. (F-I) Reprinted with permission from[85]. Copyright 2024, American Chemical Society. MMO: Mg-doped α-MnO2 configuration; XRD: X‑ray diffraction; TA: tannic acid; SEM: scanning electron microscopy.


