


fig2
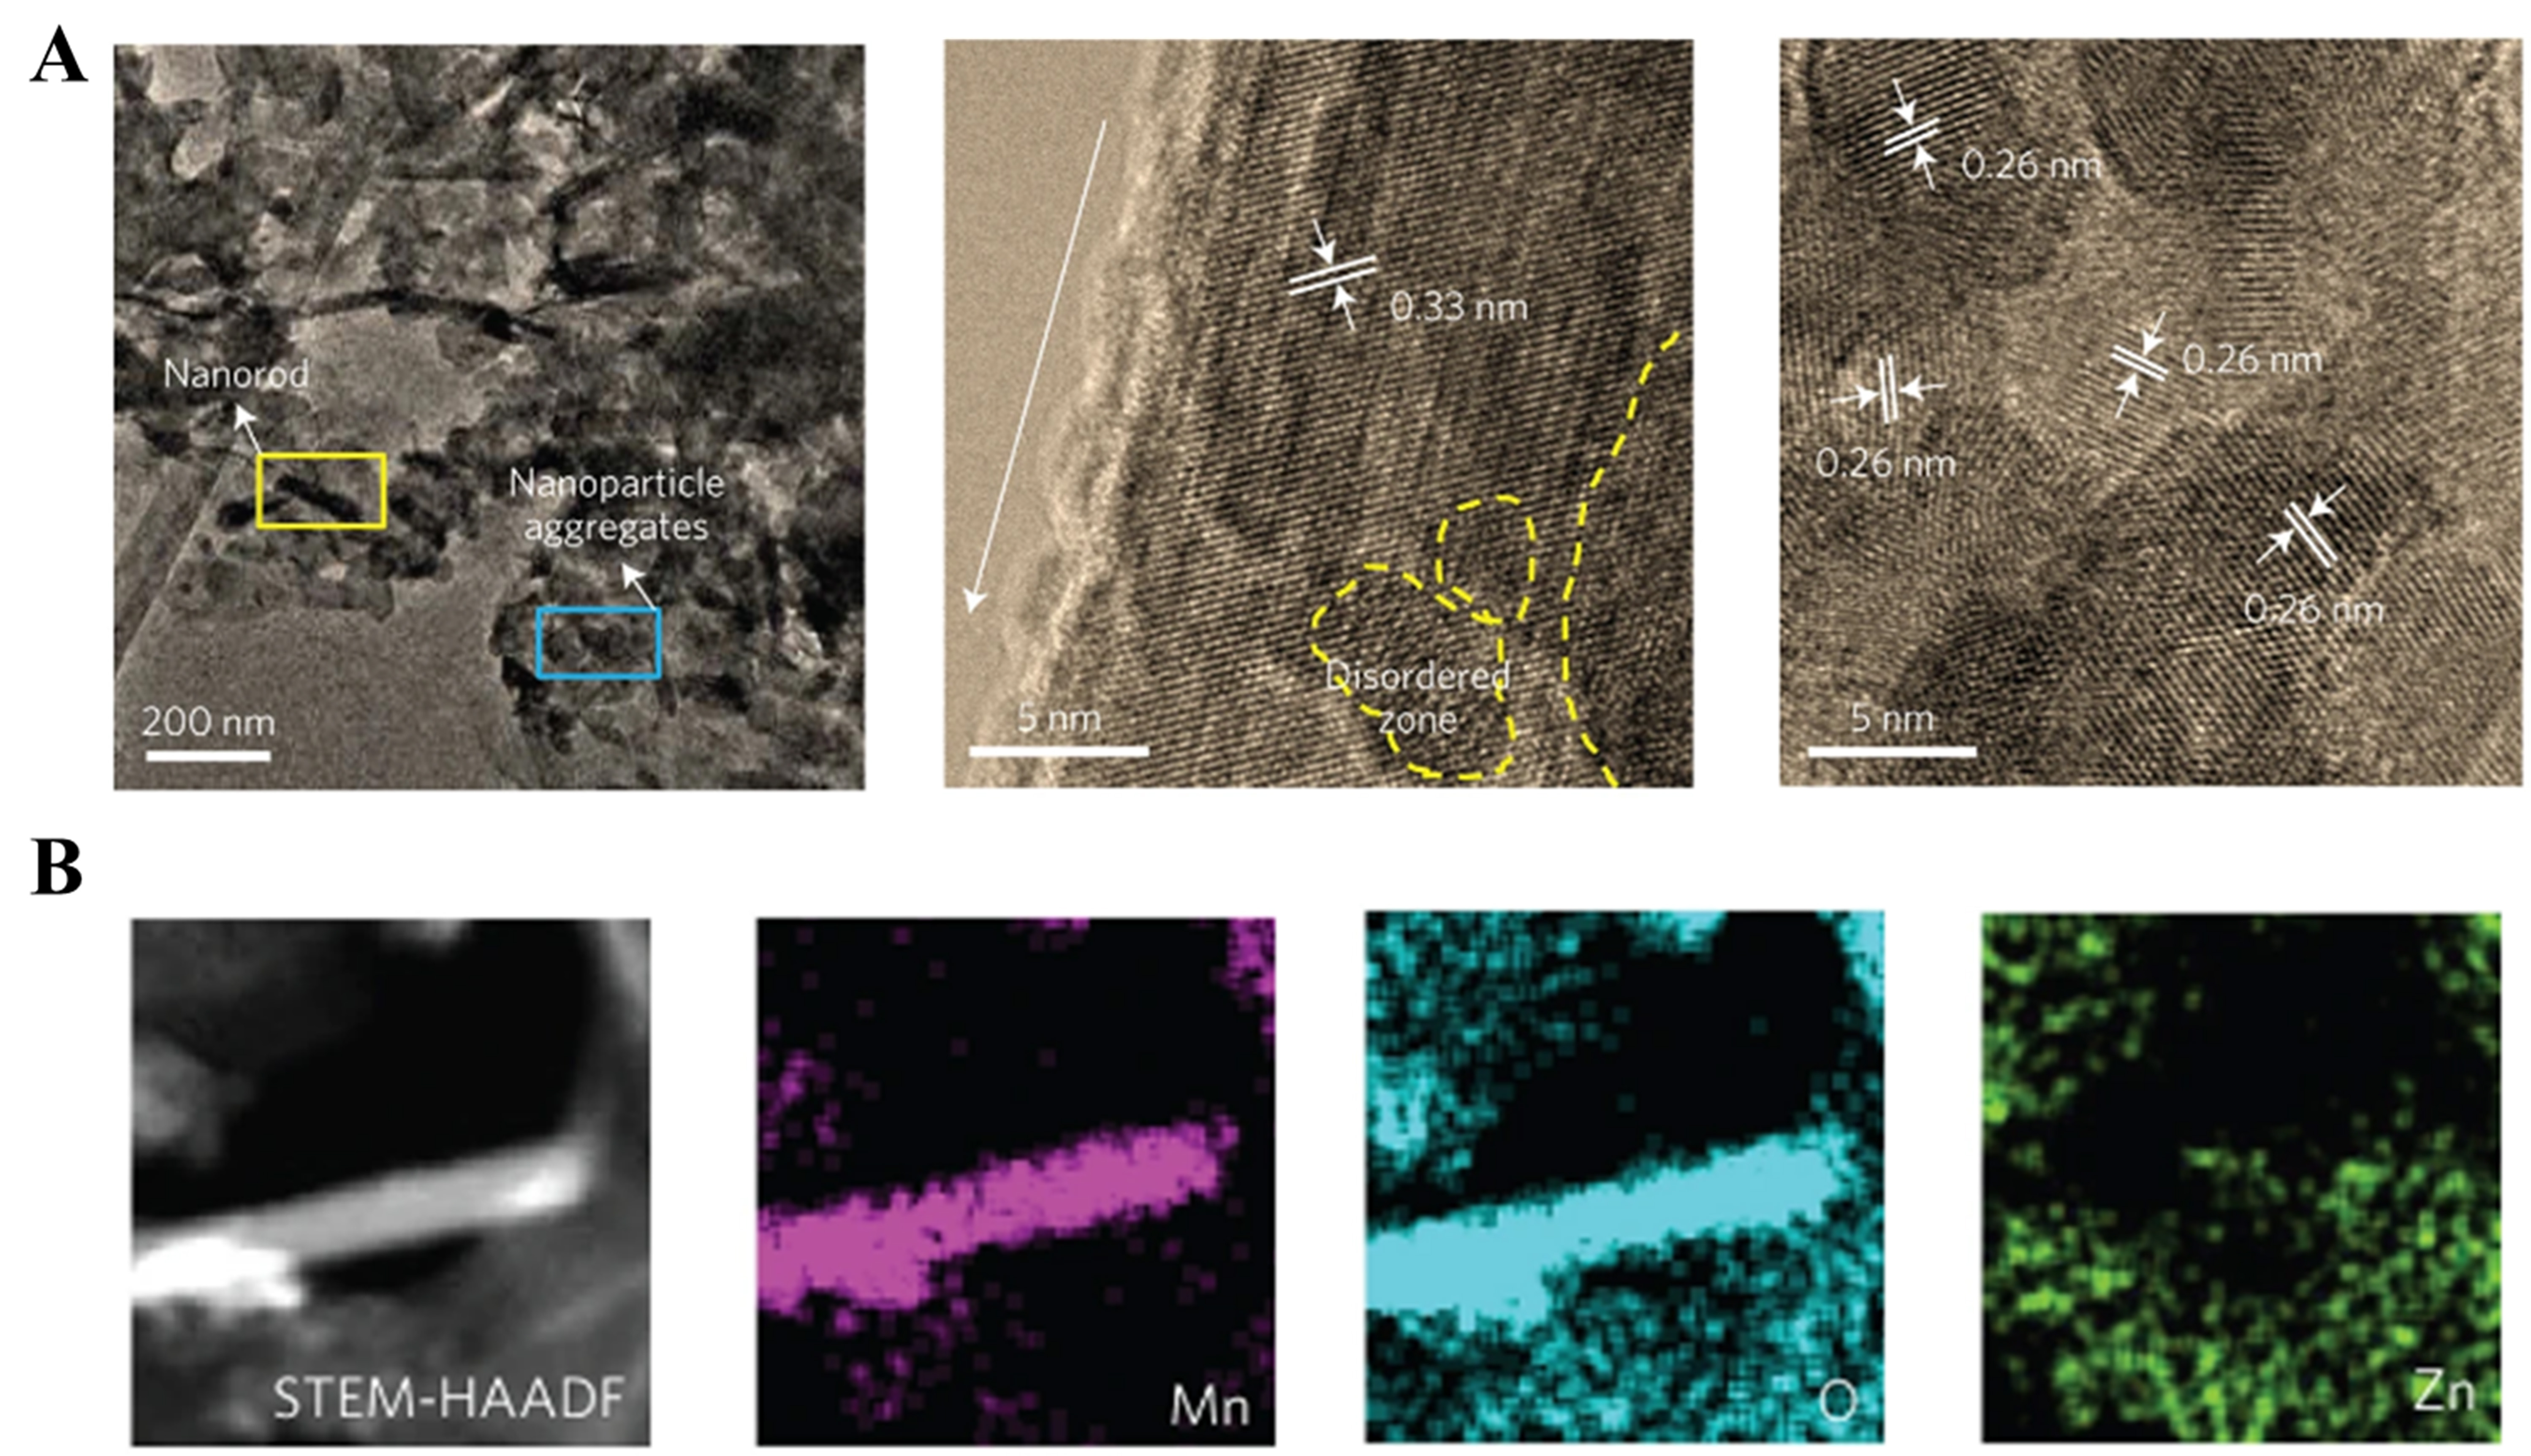
Figure 2. (A) MnO2 electrodes discharged to 1 V. The arrow indicates the growth directions of the short nanorods; (B) STEM-HAADF image of short nanorods and STEM-EDS mappings of the elemental distributions of Mn, O and Zn in the MnO2 electrode in the discharged state during the first cycle. (A and B) Reprinted with permission from[71]. Copyright 2016, Springer Nature. STEM-HAADF: Scanning transmission electron microscopy-high-angle annular dark-field; STEM-EDS: scanning transmission electron microscopy-energy dispersive X-ray spectroscopy.


