


fig1
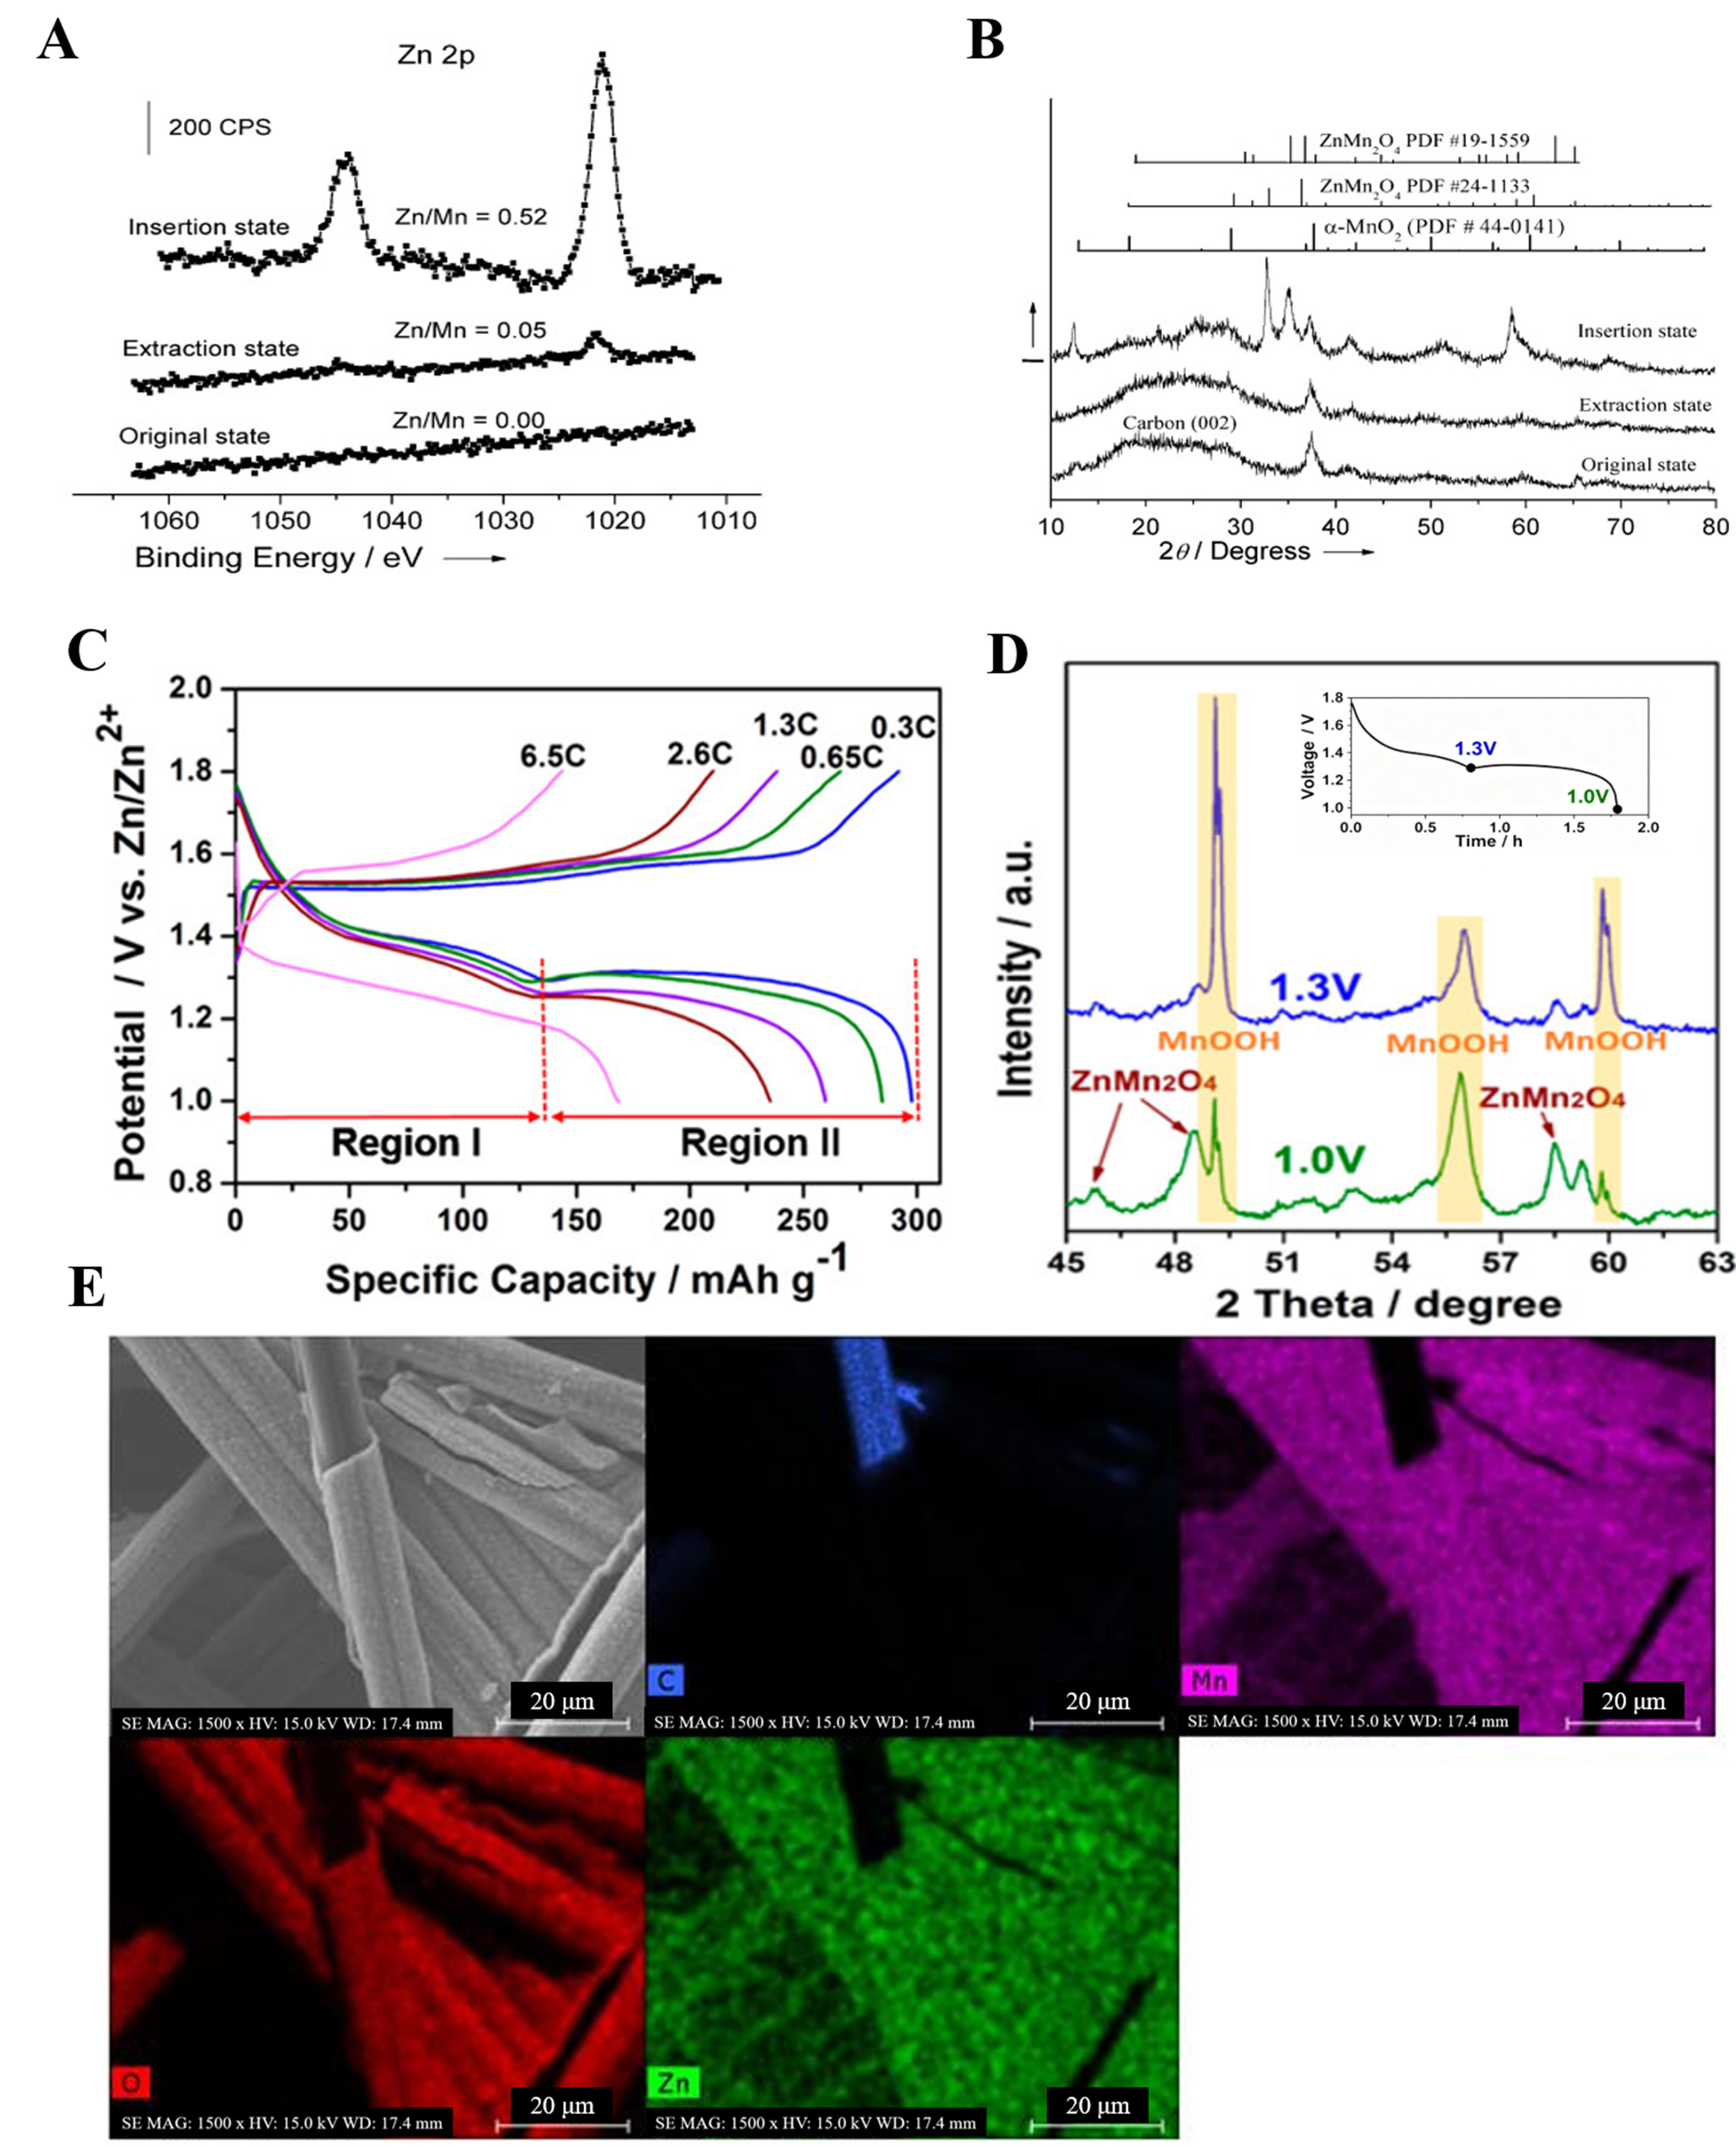
Figure 1. (A) Zn 2p core level spectra of cathodic crystalline α-MnO2 electrodes in the original, extraction, and insertion states. (B) XRD patterns of cathodic crystalline α-MnO2 electrodes in the original, extraction, and insertion states. (A and B) Reprinted with permission from[66]. Copyright 2011, Wiley; (C) charge and discharge curves at different rates in first cycle. (D) Ex-situ XRD patterns of the MnO2@CFP cathode at depth of discharge at 1.3 V and 1.0 V, respectively. (E) SEM and elemental mapping images of discharged MnO2@CFP electrode. (C-E) Reprinted with permission from[69]. Copyright 2017, American Chemical Society. XRD: X‑ray diffraction; SEM: scanning electron microscopy; CFP: carbon fiber paper.


