

fig4
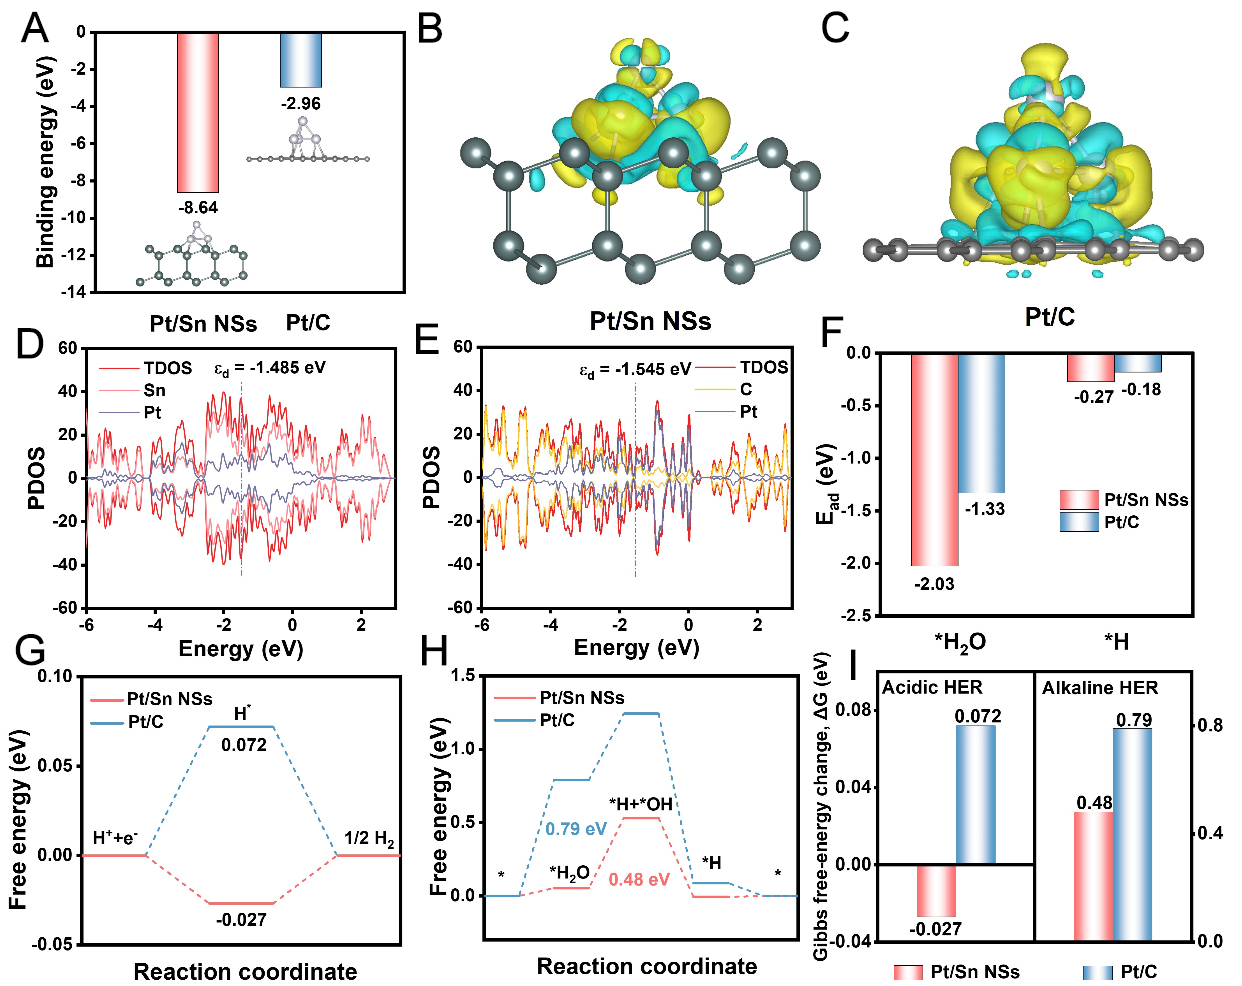
Figure 4. Theoretical investigation of the Pt-support interaction and HER reaction thermodynamics. (A) Calculated binding energies of Pt/Sn NSs (-8.64 eV) and Pt/C (-2.96 eV); the red and blue data series represent Pt/Sn NSs and Pt/C, respectively; (B and C) Charge-density-difference maps of the Pt/Sn NSs and Pt/C, respectively, in which the yellow and cyan regions indicate electron accumulation and electron depletion, respectively; (D and E) Calculated density of states and Pt d-band centers of the Pt/Sn NSs and Pt/C, respectively; the legends distinguish the total density of states (TDOS) and element-resolved projected density of states (PDOS); (F) Adsorption energies of H* and H2O on the Pt/Sn NSs and Pt/C, where the red and blue bars represent Pt/Sn NSs and Pt/C, respectively; (G) Acidic and (H) alkaline HER free-energy diagrams comparing the Pt/Sn NSs with Pt/C; the red and blue curves represent Pt/Sn NSs and Pt/C, respectively; (I) Comparison of the Gibbs free-energy changes (ΔG) associated with key HER steps on Pt/Sn NSs and Pt/C under acidic and alkaline conditions. The red and blue bars represent Pt/Sn NSs and Pt/C, respectively, and the left and right y-axes correspond to the acidic and alkaline HER free-energy scales. For alkaline HER, the values represent the maximum uphill Gibbs free-energy changes between successive states along the pathways shown in (H): 0.79 eV for H2O adsorption on Pt/C and 0.48 eV for H2O dissociation on Pt/Sn NSs. The H* adsorption energies in (F) are electronic energies, whereas the Gibbs free energies in (G) include zero-point-energy and entropy corrections. Pt/Sn NSs: Pt nanoparticle-modified Sn nanosheets; HER: hydrogen evolution reaction; Pt/C: platinum-on-carbon.