
fig11
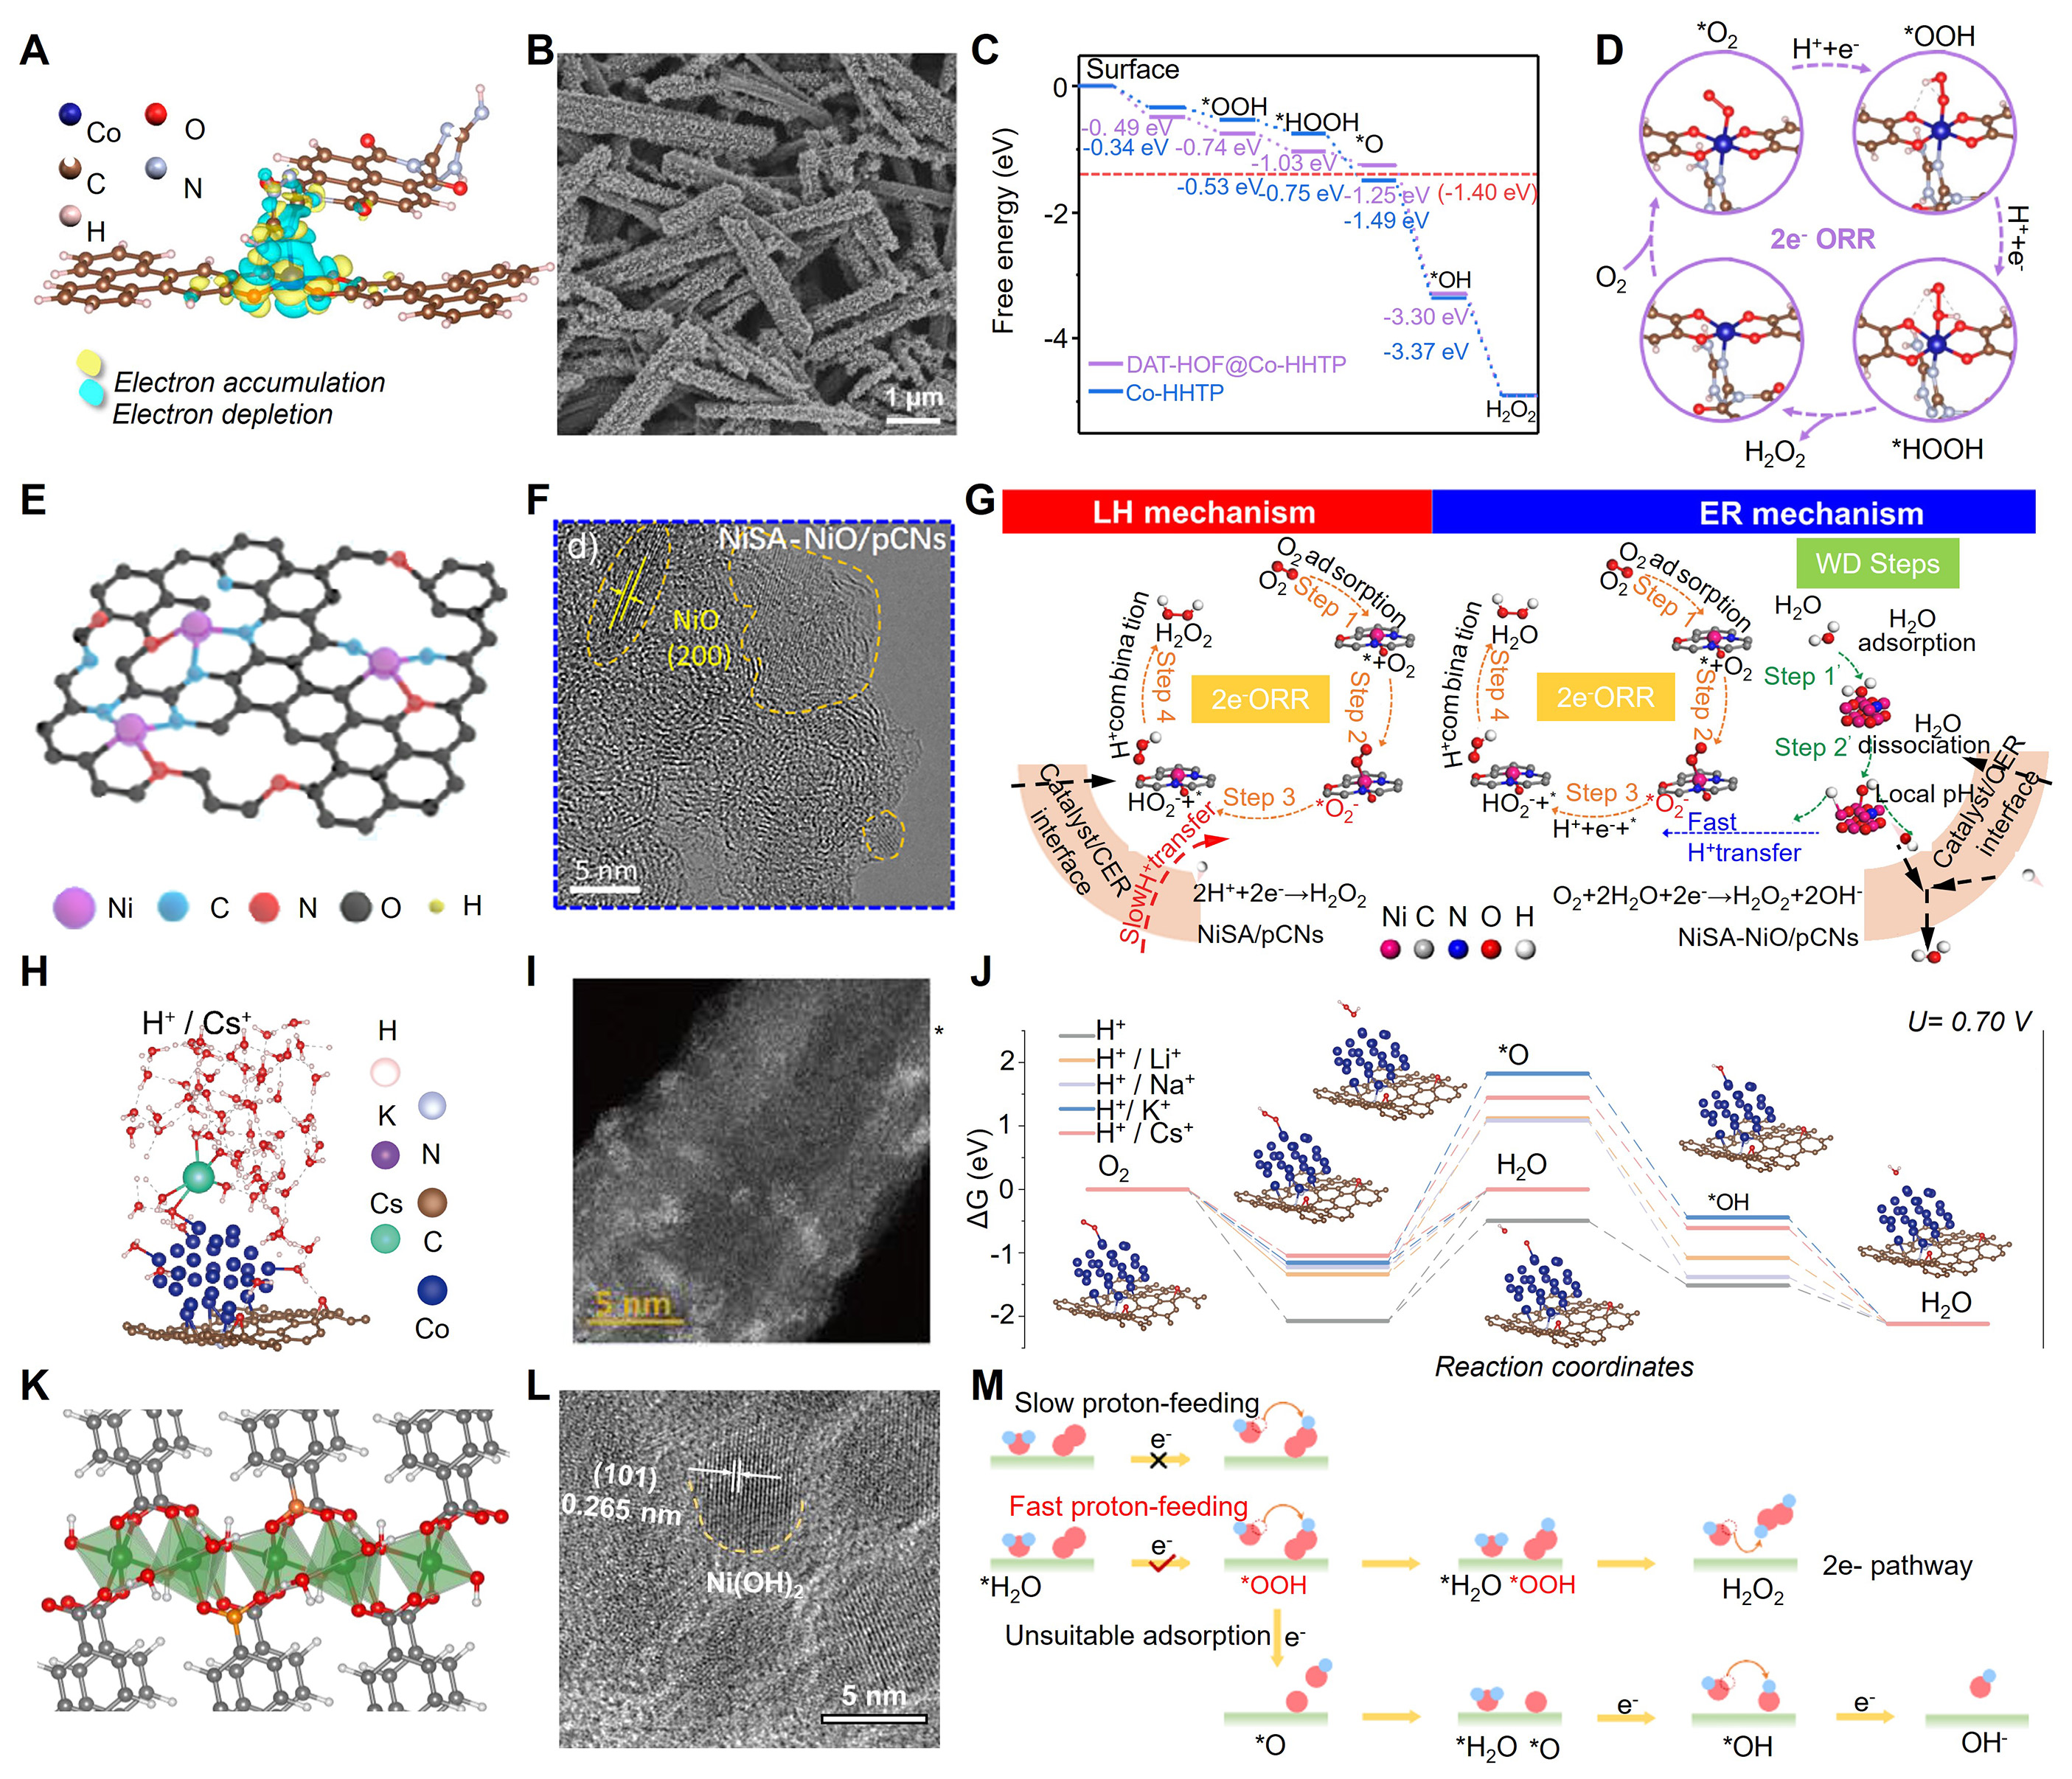
Figure 11. (A) Calculated charge-density difference of DAT-HOF@Co-HHTP heterostructure. (B) SEM image of DAT-HOF@Co-HHTP after the stability test. (C) Free-energy diagrams for oxygen reduction reaction over Co-HHTP and DAT-HOF@Co-HHTP heterostructure. (D) Schematic diagram of the oxygen reduction reaction pathways over DAT-HOF@Co-HHTP heterostructure. (A-D) is reprinted with permission from Ref.[208]. Copyright © 2025 Springer Nature. (E) Final structural model in the schematic illustration for the synthesis process of NiSA-NiO/pCNs; C, H, O, N, and Ni are shown in grey, yellow, red, blue, and purple, respectively. (F) High-resolution TEM image of NiSA-NiO/pCNs, where NiO lattices are circled by dashed lines. (G) Proposed illustration of two catalytic pathways for the two-electron oxygen reduction reaction process in chlorine evolution reaction electrolyte. (E-G) is reprinted with permission from Ref.[248]. Copyright © 2025 Wiley-VCH GmbH. (H) Optimized computational adsorption configuration model on the Co-CNT catalyst in Cs+-containing acidic electrolyte. (I) AC-HAADF-STEM image of Co-CNT. (J) Free-energy diagrams for oxygen reduction reaction on Co-CNT catalysts across different electrolyte systems at 0.7 V_RHE, including both the 4e- and the two-electron reaction pathways; the insets show molecular models of different stages for H2O2 synthesis. (H-J) is reprinted with permission from Ref.[249]. Copyright © 2026 Springer Nature. (K) Fitting models for B-NiBDC; gray, white, green, red, and orange represent C, H, Ni, O, and B atoms, respectively. (L) HRTEM image of B-NiBDC after the two-electron oxygen reduction reaction tests. (M) Efficient the two-electron oxygen reduction reaction pathway enabled by proton feeding and suitable *OOH adsorption. (K-M) is reprinted with permission from Ref.[250]. Copyright © 2025 Springer Nature.