

fig5
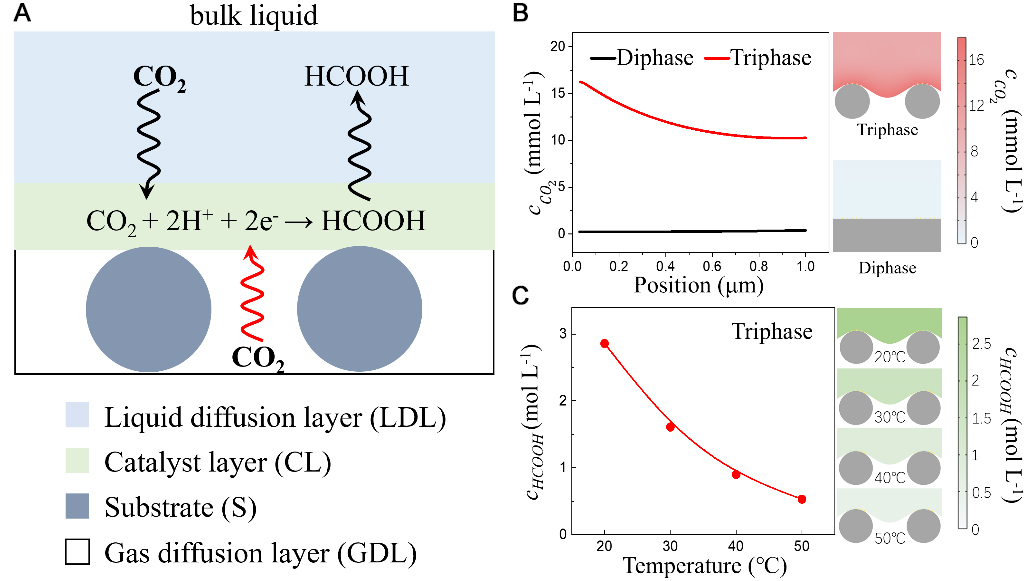
Figure 5. (A) The schematic diagram of the computational domain with boundary indicators; (B) Simulated CO2 concentration profiles as a function of distance from the triphase interface into the solution for the triphase (red) and diphase (black) systems at 50 °C. Diagram on the right is CO2 concentration diffusion model in the triphase (the upper) and diphase (the lower) systems; (C) Simulated local formate concentration at the reaction interface as a function of temperature in the triphase system. Diagram on the right is the formate concentration diffusion model.