
fig3
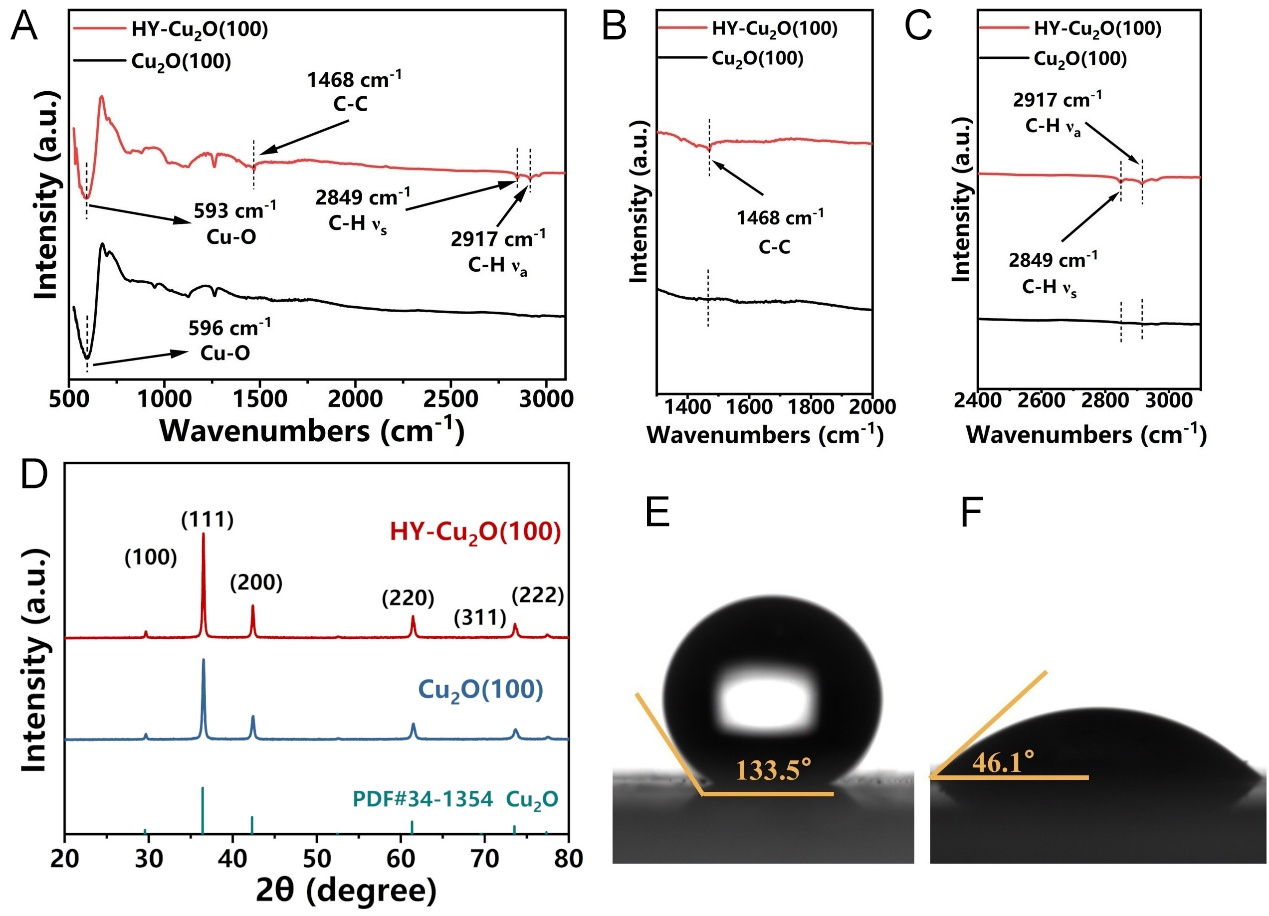
Figure 3. (A) ATR-FTIR spectra of Cu2O (100) and HY-Cu2O (100); Local ATR-FTIR spectra of (B and C) Cu2O (100) and HY-Cu2O (100); (D) XRD patterns of Cu2O (100) and HY-Cu2O (100); (E and F) Experimental optical images of the hydrophilic and hydrophobic properties of Cu2O (100) and HY-Cu2O (100). XRD: X-ray diffraction; ATR-FTIR: attenuated total reflectance Fourier-transform infrared spectroscopy.