



fig2
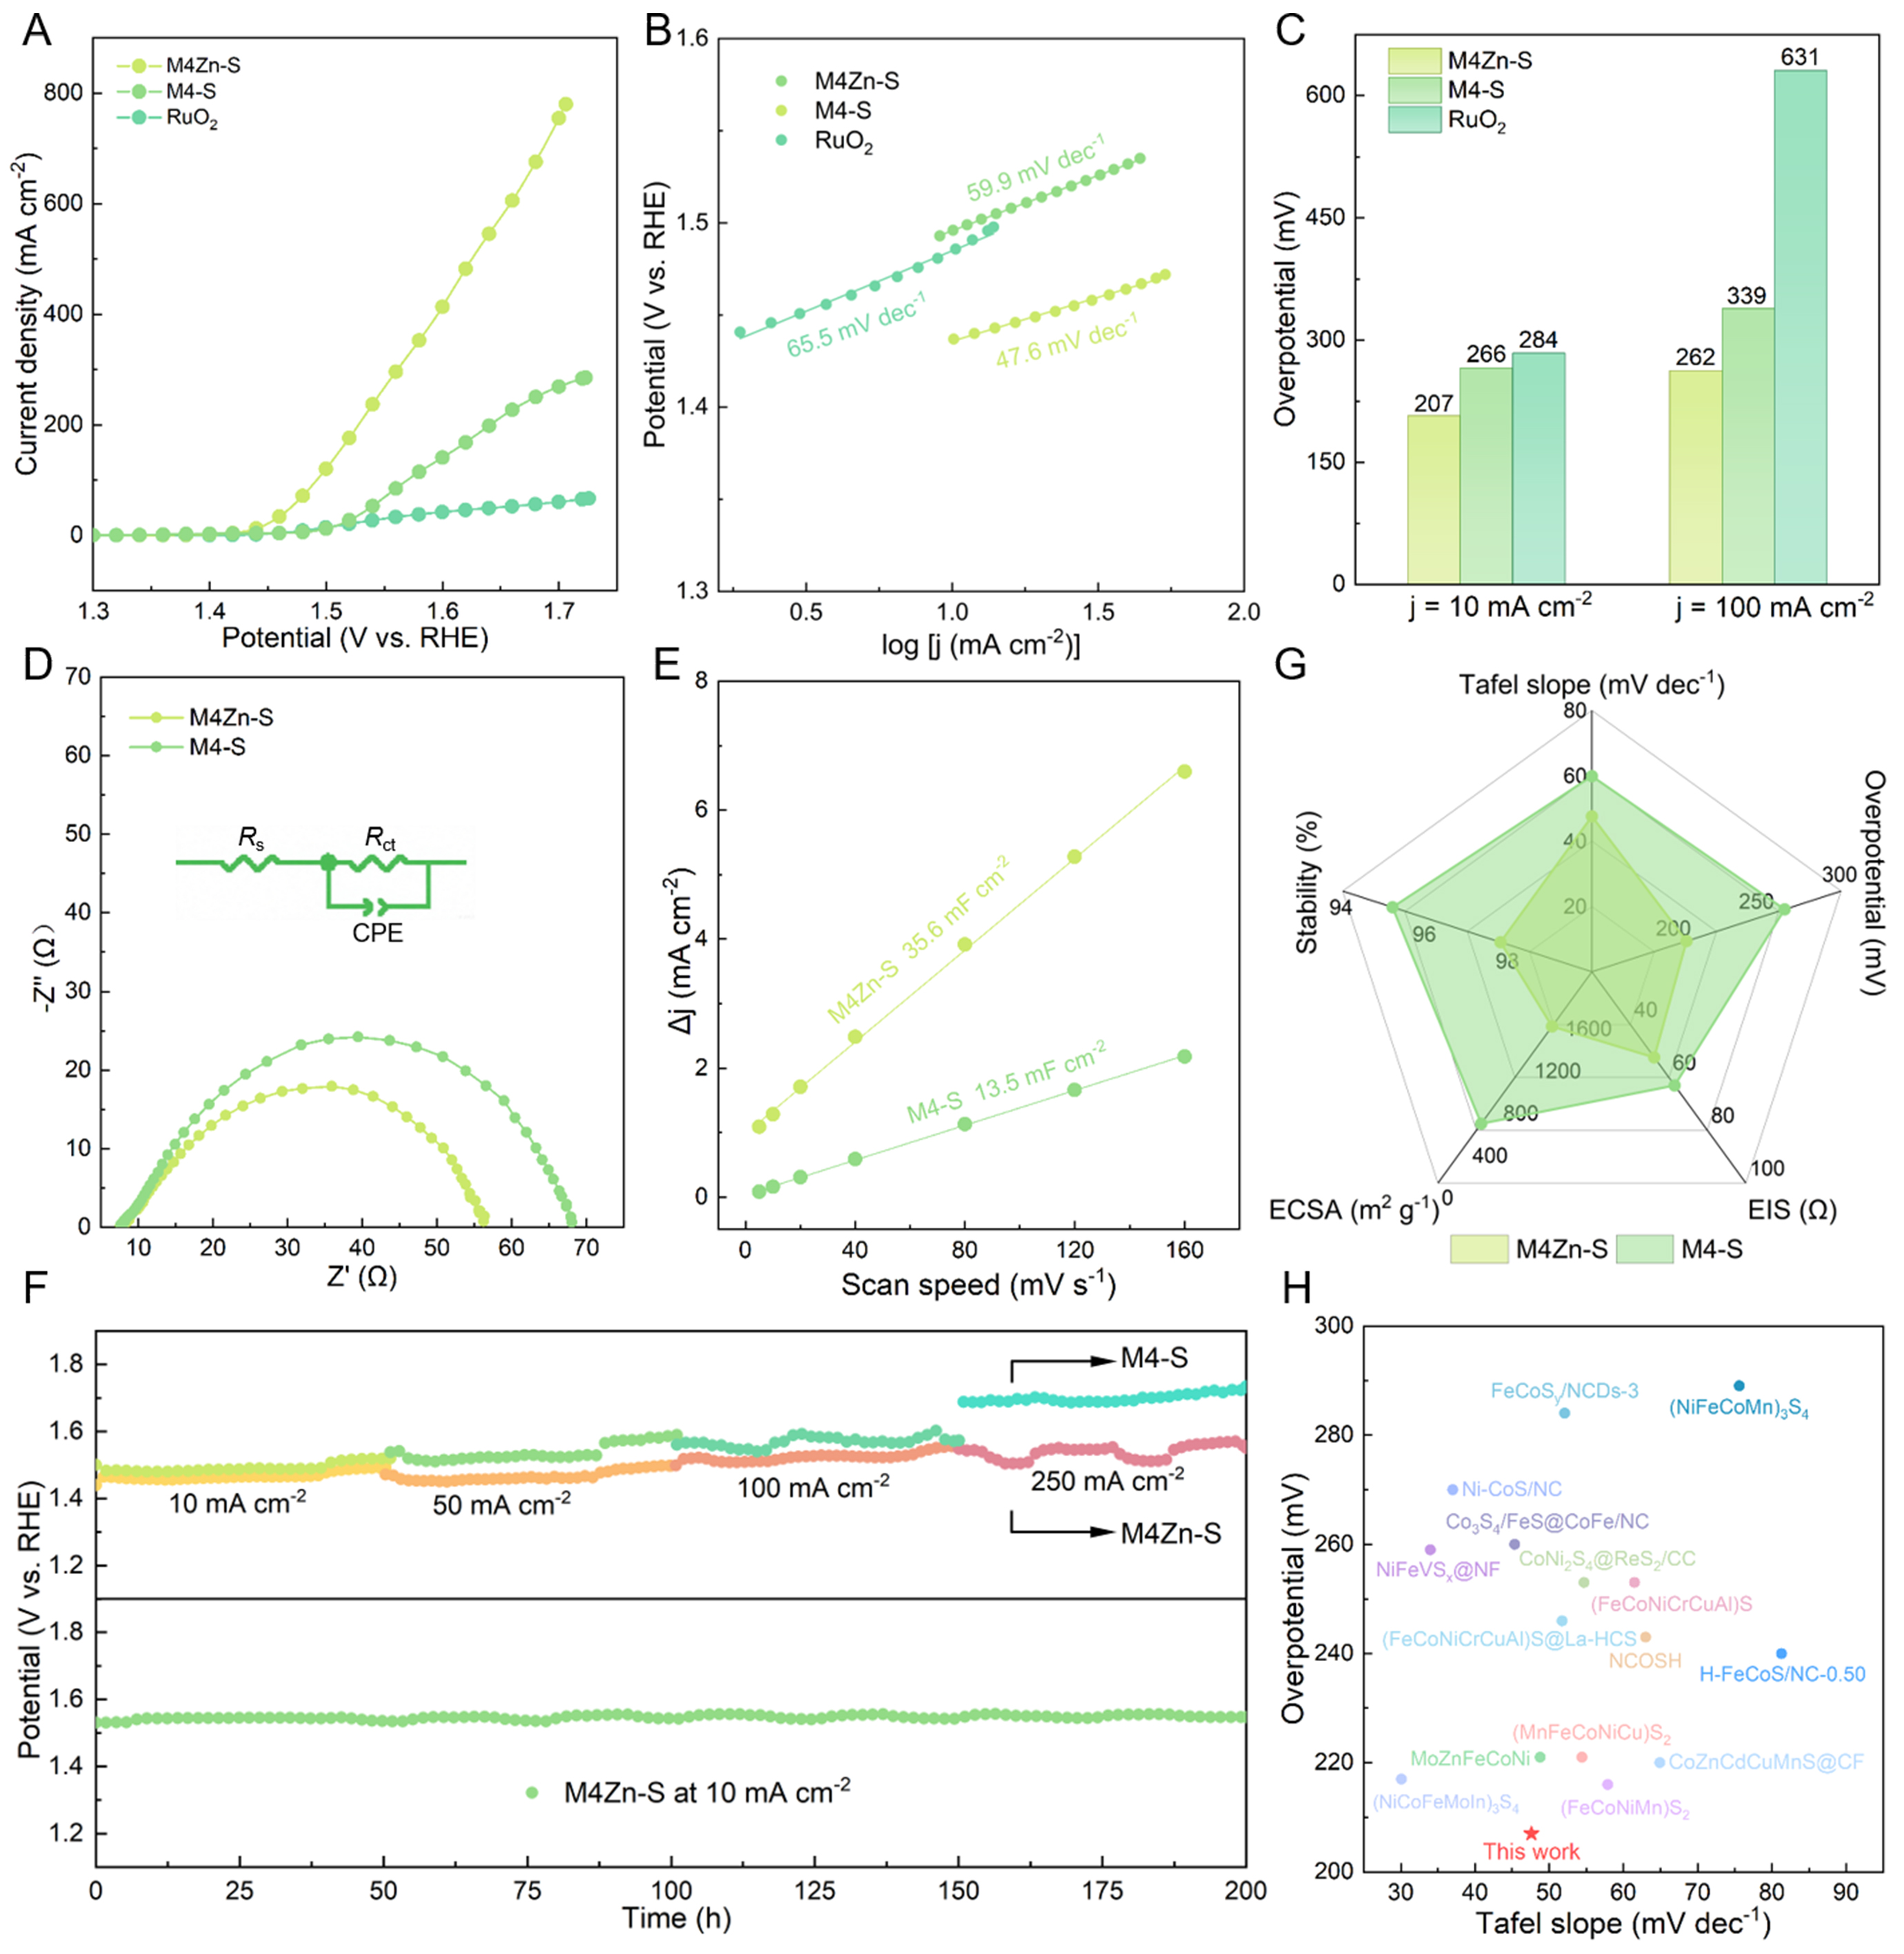
Figure 2. Electrocatalytic performance of M4Zn-S and M4-S. (A) LSV curves, (B) Tafel plots, (C) overpotentials at 10 and 100 mA cm-2, (D) Nyquist plots (inset shows the fitted equivalent circuit), (E) Cdl values derived from multiscan-rate CV measurements, (F) long-term stability tests, and (G) performance radar chart of M4Zn-S and M4-S; (H) Comparison of Tafel slopes and overpotential with reported catalysts. LSV: Linear sweep voltammetry; CV: cyclic voltammetry.





