

fig1
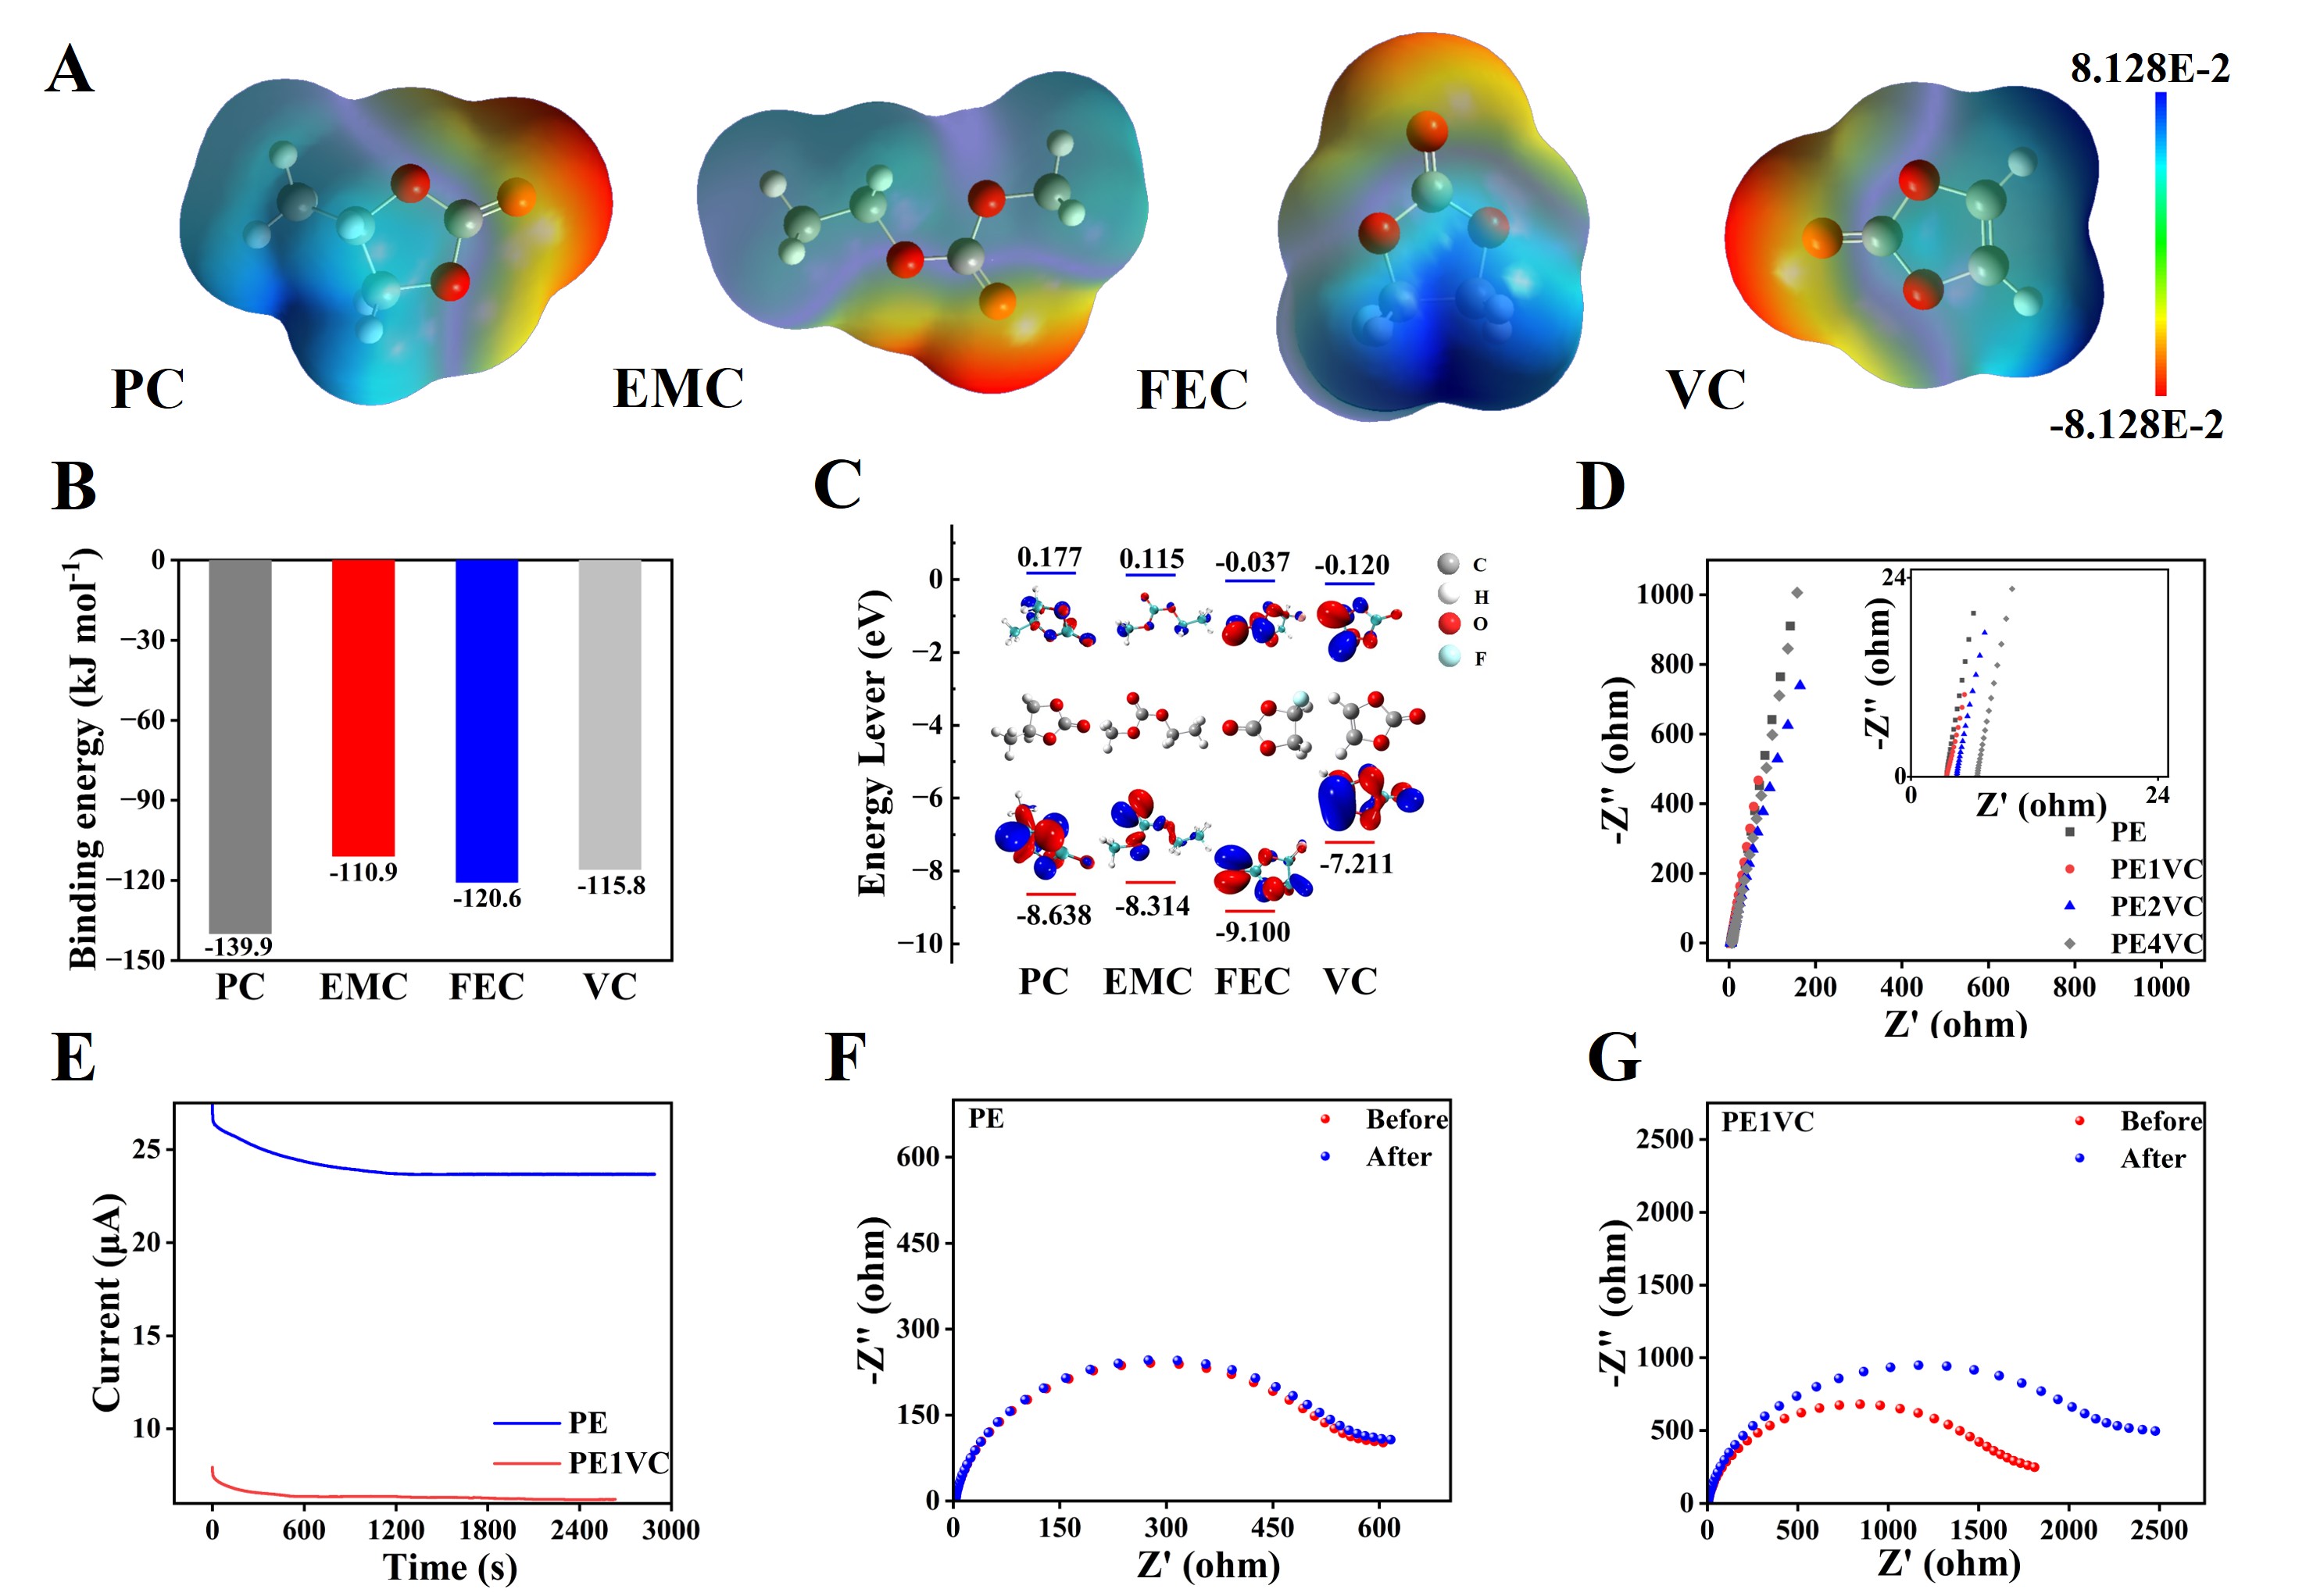
Figure 1. (A) ESP image of PC, EMC, FEC and VC; (B) Binding energies of PC, EMC, FEC and VC with Na+; (C) HOMO and LUMO energy levels of PC, EMC, FEC and VC; (D) EIS of four electrolytes, with the enlarged view in the inset; (E) Chronoamperometric curves of the Na||Na cells with PE and PE1VC electrolytes, respectively; (F and G) EIS of the Na||Na cells before and after the chronoamperometric test with PE and PE1VC electrolytes, respectively.