

fig5
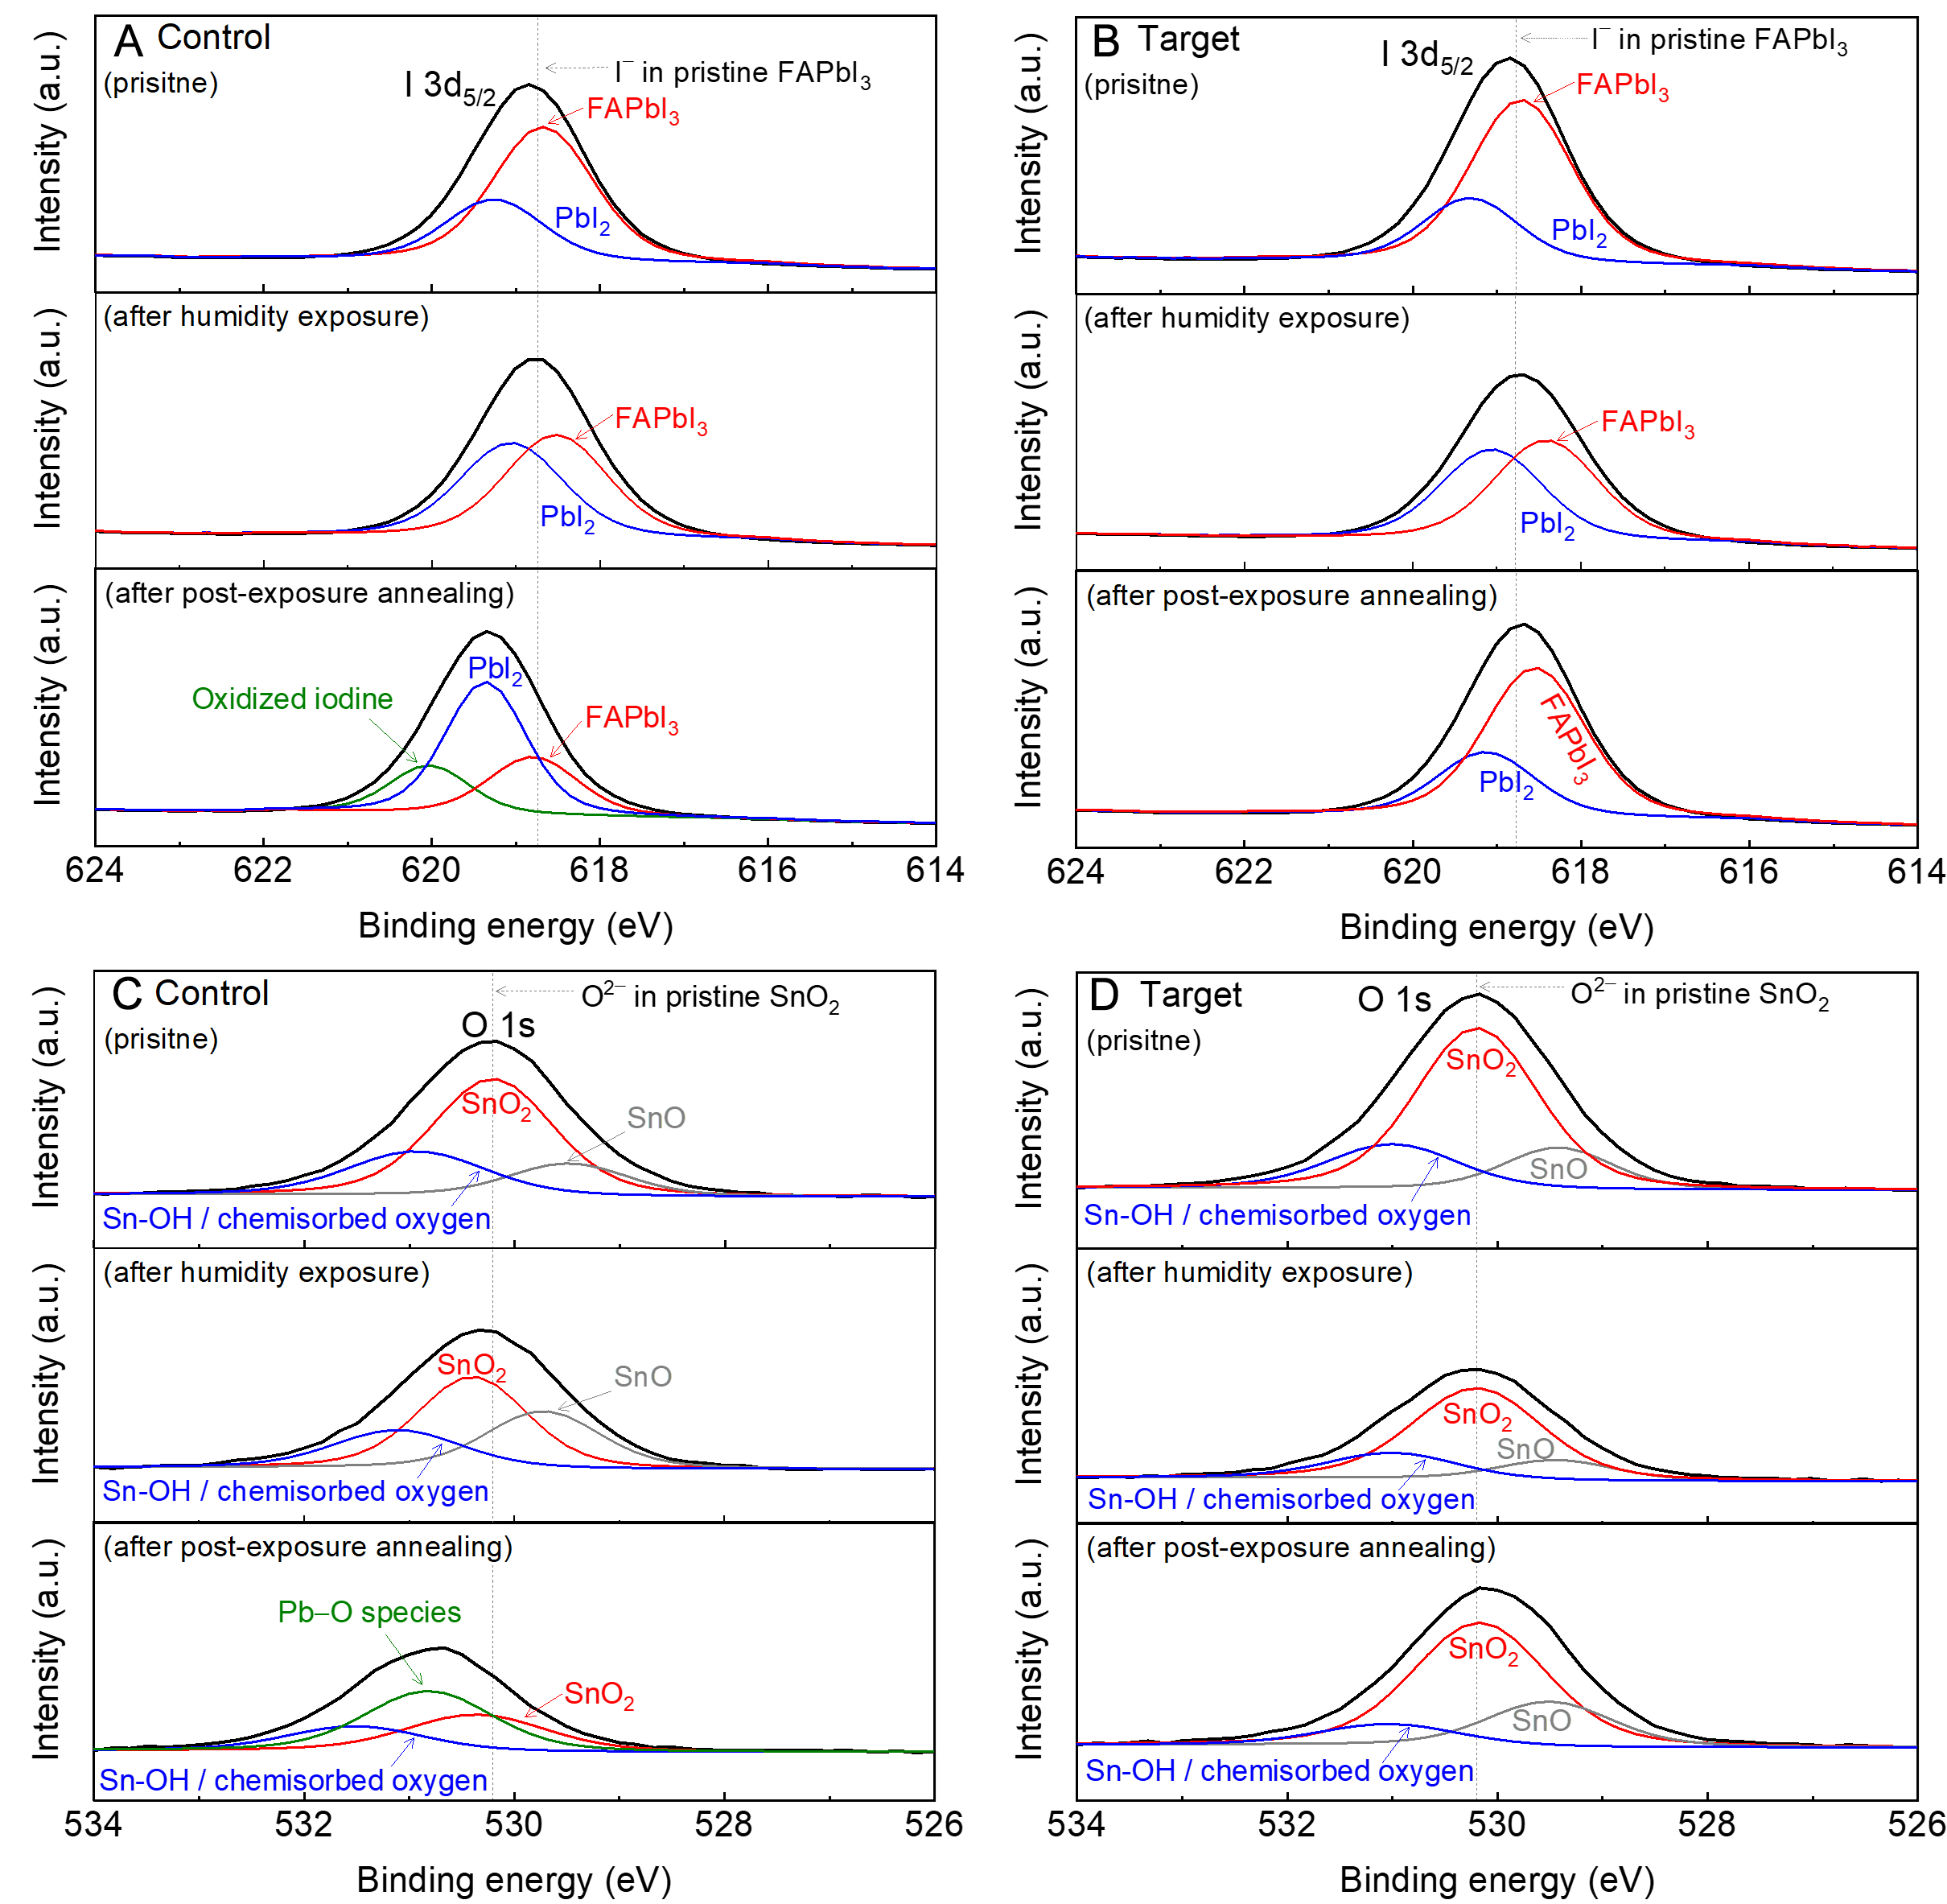
Figure 5. I 3d5/2 XPS spectra of the (A) control and (B) target films, with dashed lines indicating I- in the pristine FAPbI3 lattice. O 1s XPS spectra of the (C) control and (D) target films, with dashed lines indicating O2- in the pristine SnO2 lattice. The I 3d5/2 XPS spectra were acquired at a depth of 400 nm, corresponding to the overlying FAPbI3 region near the buried interface, whereas the O 1s spectra were acquired at a depth of 600 nm, corresponding to the underlying SnO2 region near the buried interface. All spectra were collected at each of the three sequential stages. XPS: X-ray photoelectron spectroscopy.





