



fig5
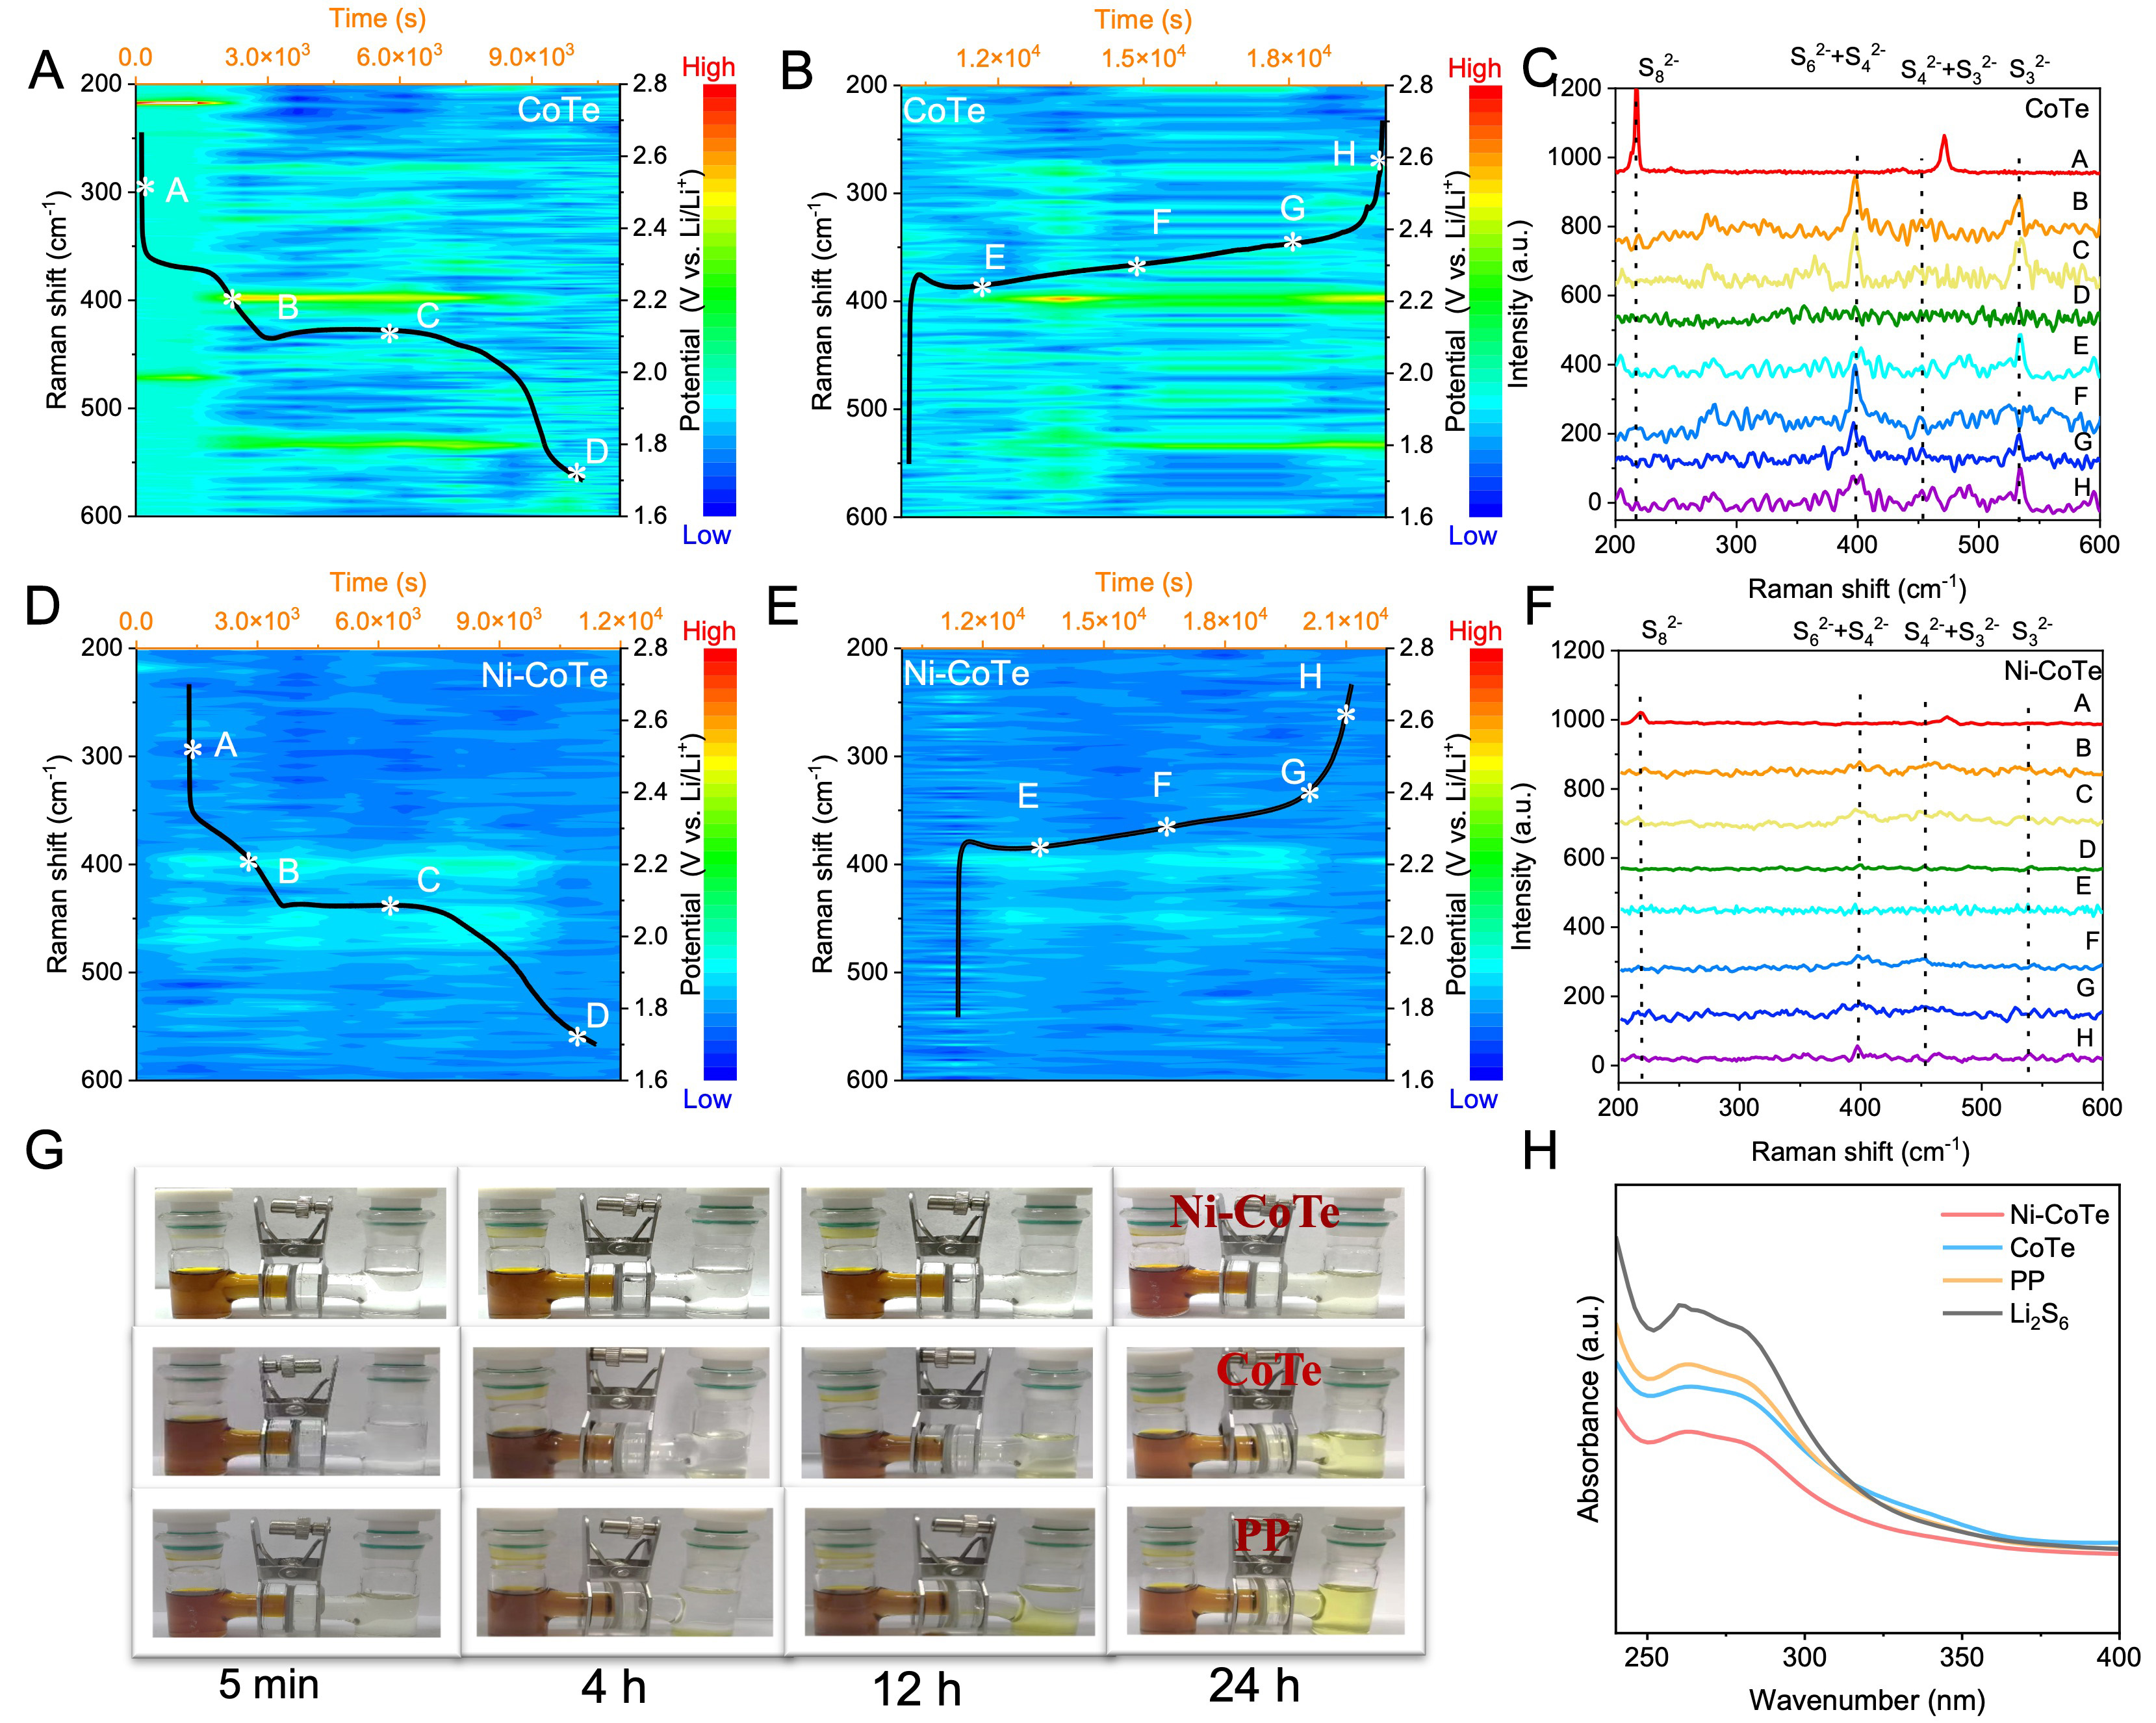
Figure 5. Time-resolved Raman spectra of Li-S batteries during discharge and charge at 0.2 C, with (A-C) CoTe and (D-F) Ni-CoTe coated separators. The black curves on the contour maps show the galvanostatic voltage profiles, with white stars A-H indicating the electrochemical states for the representative Raman spectra. (A-D )and (E-H) denote selected states during discharge and charge, respectively. The corresponding Raman spectra for states A-H are presented in (C) for the CoTe battery and in (F) for the Ni-CoTe battery; (G) Polysulfide permeation in H-type cells using Ni-CoTe-coated, CoTe-coated, and uncoated PP separators; (H) UV-vis spectra of the blank-side electrolytes after 24 h for the three configurations. UV-vis: Ultraviolet-visible.





